
Page 74 - Statistics presented by Dr. Sara Ismail Aborass
P. 74
9/8/2023
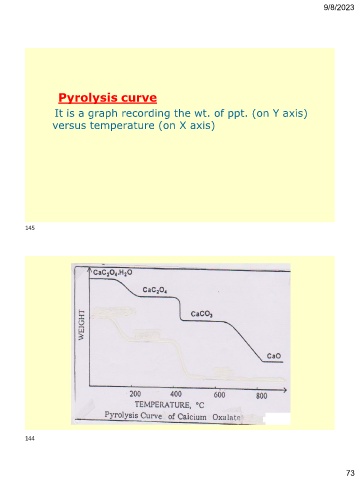
Pyrolysis curve
It is a graph recording the wt. of ppt. (on Y axis)
versus temperature (on X axis)
145
144
73