
Page 10 - Appraisal 2018
P. 10
38202
Market Conditions Addendum to the Appraisal Report File No. 180529004
The purpose of this addendum is to provide the lender/client with a clear and accurate understanding of the market trends and conditions prevalent in the subject
neighborhood. This is a required addendum for all appraisal reports with an effective date on or after April 1, 2009.
Property Address 22 Dow St City Portland State ME ZIP Code 04102
Borrower Matthew Power
Instructions: The appraiser must use the information required on this form as the basis for his/her conclusions, and must provide support for those conclusions, regarding
housing trends and overall market conditions as reported in the Neighborhood section of the appraisal report form. The appraiser must fill in all the information to the extent
it is available and reliable and must provide analysis as indicated below. If any required data is unavailable or is considered unreliable, the appraiser must provide an
explanation. It is recognized that not all data sources will be able to provide data for the shaded areas below; if it is available, however, the appraiser must include the data
in the analysis. If data sources provide the required information as an average instead of the median, the appraiser should report the available figure and identify it as an
average. Sales and listings must be properties that compete with the subject property, determined by applying the criteria that would be used by a prospective buyer of the
subject property. The appraiser must explain any anomalies in the data, such as seasonal markets, new construction, foreclosures, etc.
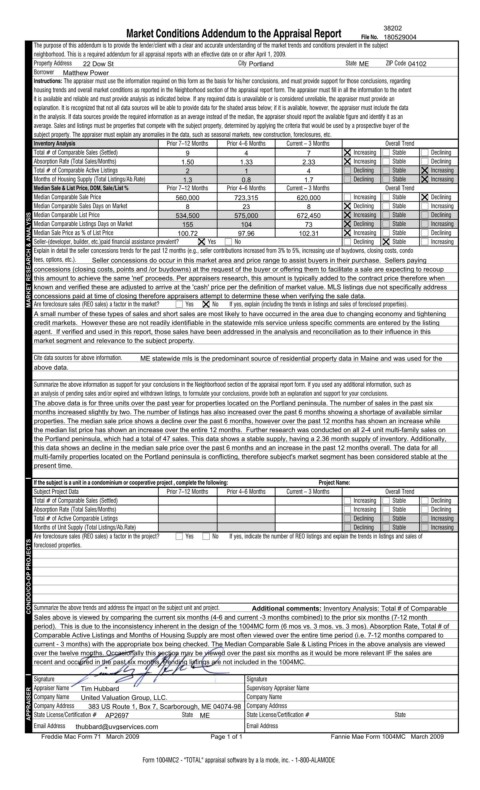
Inventory Analysis Prior 7–12 Months Prior 4–6 Months Current – 3 Months Overall Trend
Total # of Comparable Sales (Settled) 9 4 7 Increasing Stable Declining
Absorption Rate (Total Sales/Months) 1.50 1.33 2.33 Increasing Stable Declining
Total # of Comparable Active Listings 2 1 4 Declining Stable Increasing
Months of Housing Supply (Total Listings/Ab.Rate) 1.3 0.8 1.7 Declining Stable Increasing
Median Sale & List Price, DOM, Sale/List % Prior 7–12 Months Prior 4–6 Months Current – 3 Months Overall Trend
Median Comparable Sale Price 560,000 723,315 620,000 Increasing Stable Declining
Median Comparable Sales Days on Market 534,500 575,000 672,450 Declining Stable Increasing
23
8
8
Declining
Median Comparable List Price
Increasing
Stable
MARKET RESEARCH & ANALYSIS Median Sale Price as % of List Price 100.72 Yes No 97.96 102.31 Increasing Stable Declining
Declining
Increasing
Stable
Median Comparable Listings Days on Market
155
104
73
Stable
Seller-(developer, builder, etc.)paid financial assistance prevalent?
Declining
Increasing
Explain in detail the seller concessions trends for the past 12 months (e.g., seller contributions increased from 3% to 5%, increasing use of buydowns, closing costs, condo
fees, options, etc.).
Seller concessions do occur in this market area and price range to assist buyers in their purchase. Sellers paying
concessions (closing costs, points and /or buydowns) at the request of the buyer or offering them to facilitate a sale are expecting to recoup
this amount to achieve the same 'net' proceeds. Per appraisers research, this amount is typically added to the contract price therefore when
known and verified these are adjusted to arrive at the 'cash' price per the definition of market value. MLS listings due not specifically address
concessions paid at time of closing therefore appraisers attempt to determine these when verifying the sale data.
No
If yes, explain (including the trends in listings and sales of foreclosed properties).
Yes
Are foreclosure sales (REO sales) a factor in the market?
A small number of these types of sales and short sales are most likely to have occurred in the area due to changing economy and tightening
credit markets. However these are not readily identifiable in the statewide mls service unless specific comments are entered by the listing
agent. If verified and used in this report, those sales have been addressed in the analysis and reconciliation as to their influence in this
market segment and relevance to the subject property.
Cite data sources for above information. ME statewide mls is the predominant source of residential property data in Maine and was used for the
above data.
Summarize the above information as support for your conclusions in the Neighborhood section of the appraisal report form. If you used any additional information, such as
an analysis of pending sales and/or expired and withdrawn listings, to formulate your conclusions, provide both an explanation and support for your conclusions.
The above data is for three units over the past year for properties located on the Portland peninsula. The number of sales in the past six
months increased slightly by two. The number of listings has also increased over the past 6 months showing a shortage of available similar
properties. The median sale price shows a decline over the past 6 months, however over the past 12 months has shown an increase while
the median list price has shown an increase over the entire 12 months. Further research was conducted on all 2-4 unit multi-family sales on
the Portland peninsula, which had a total of 47 sales. This data shows a stable supply, having a 2.36 month supply of inventory. Additionally,
this data shows an decline in the median sale price over the past 6 months and an increase in the past 12 months overall. The data for all
multi-family properties located on the Portland peninsula is conflicting, therefore subject's market segment has been considered stable at the
present time.
If the subject is a unit in a condominium or cooperative project , complete the following: Project Name:
Subject Project Data Prior 7–12 Months Prior 4–6 Months Current – 3 Months Overall Trend
Total # of Comparable Sales (Settled) Increasing Stable Declining
Absorption Rate (Total Sales/Months) Increasing Stable Declining
Total # of Active Comparable Listings Declining Stable Increasing
Months of Unit Supply (Total Listings/Ab.Rate) Yes No If yes, indicate the number of REO listings and explain the trends in listings and sales of Increasing
Declining
Stable
CONDO/CO-OP PROJECTS Are foreclosure sales (REO sales) a factor in the project?
foreclosed properties.
Summarize the above trends and address the impact on the subject unit and project.
Additional comments: Inventory Analysis: Total # of Comparable
Sales above is viewed by comparing the current six months (4-6 and current -3 months combined) to the prior six months (7-12 month
period). This is due to the inconsistency inherent in the design of the 1004MC form (6 mos vs. 3 mos. vs. 3 mos). Absorption Rate, Total # of
Comparable Active Listings and Months of Housing Supply are most often viewed over the entire time period (i.e. 7-12 months compared to
current - 3 months) with the appropriate box being checked. The Median Comparable Sale & Listing Prices in the above analysis are viewed
over the twelve months. Occasionally this section may be viewed over the past six months as it would be more relevant IF the sales are
recent and occurred in the past six months. Pending listings are not included in the 1004MC.
Signature Tim Hubbard Signature
Appraiser Name
Supervisory Appraiser Name
APPRAISER Company Name United Valuation Group, LLC. State Company Name State
383 US Route 1, Box 7, Scarborough, ME 04074-9843 Company Address
Company Address
State License/Certification #
State License/Certification #
AP2697
Email Address thubbard@uvgservices.com ME Email Address
Freddie Mac Form 71 March 2009 Page 1 of 1 Fannie Mae Form 1004MC March 2009
Form 1004MC2 - "TOTAL" appraisal software by a la mode, inc. - 1-800-ALAMODE