
Page 392 - Atlas Sea Birds Ver1
P. 392
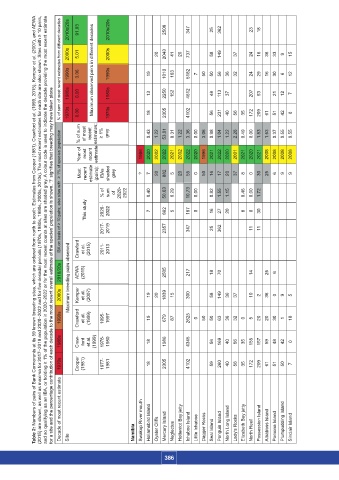
and so qualifying as an IBA, or holding ≥ 1% of the population in 2020–2022 or for the most recent counts at sites are shaded grey. A colour code is used to indicate the decade providing the most recent estimate
                     (2015) are shown, as well as maxima for 2017–2019 and 2020–2022 and for five decadal periods (1970s, 1980s, 1990s, 2000s, 2010s). The most recent estimates for each site are also shown. Sites with ≥ 10 pairs,
                   Table 2: Numbers of pairs of Bank Cormorants at its 59 known breeding sites, which are ordered from north to south. Estimates from Cooper (1981), Crawford et al. (1999, 2015), Kemper et al. (2007), and AEWA
                            % of sum of most recent estimates from different decades
                               2010s/20s  91.93  2010s/20s        2508        347        25  362           23  18

                               2000s  5.01   2000s             20  2043  41  20  737        58  149     37     24  16  36  33  9  15


                               1990s  3.06  Maximum observed pairs in different decades  1990s  19     1010  103     5182  7  50  50  56  36  32     24  29  16  30  6  12


                         for a site and the percentage contribution of each decade to the most recent overall estimate of the species’ population is shown. ‘?’ signifies that breeding may have taken place
                               1980s  0.00    1980s         13     2250  152     4612        48  113  37        207  53     21  12  7

                               1970s  0.00   1970s          18     2305        4102        56  231  40  56  35  172  209  61  51  42  0


                                   % of sum   of most   recent   estimates;    ≥ 1%    grey  0.43  1.22  53.91  0.31  1.22  3.36  0.00  3.06  0.98  1.04  1.22  2.26  0.49  0.00  1.83  1.53  0.37  0.55  0.55
                            IBA on basis of ≥ 10 pairs; also sites with  ≥ 1% of species' population


                                   Year of   most   recent   estimate  1986  2020  2002  2022  2021  2002  2022  2020  1996  2021  2022  2020  2001  2021  2020  2021  2008  2008  2008  2008


                                   Most   recent   estimate   (pairs);   IBAs   shaded   grey     ?  7  20  882  5  20  55  0  50  16  17  20  37  8  0  30  25  6  9  9


                                           % of   sum  of   2020-  2022  0.40     50.63  0.29     10.73  0.00     0.92  1.55  1.15     0.46  0.00  1.72
                                     This study  2020-  2022  7  882  5     187  0     16  27  20     8  0  30


                                           2017-  2011-  2019  2013  2357  347    25  362       11  11


                                   Crawford
                                       (2015)
                                     et al.
                               Maximum breeding pairs observed
                            2010/20s  AEWA   (2015)               2505        217        18  70           14     25  6


                            2000s  Kemper   et al.   (2007)     19  20  1839  15     300        58  149  36  37     10  2  36  0  9  5


                            1990s  Crawford   et al.   (1999)  1995-  1997  19  679  87  2625  0  50  50  63  36  32  0  5  20  20  30  1  18


                            1980s  Craw-  ford   et al.   (1999)  1978-  1980  18  1986  4345  56  169  40  56  35  155  157  59  48  42  0


                            1970s  Cooper   (1981)  1977-  1981  18     2305        4102        59  260  40  56  35  172  209  61  51  50  7


                            Decade of most recent estimate  Namibia  Swakop River mouth  Hollamsbird Island  Oyster Cliffs  Mercury Island  Neglectus  Hottentot Bay jetty  Ichaboe Island  Little Ichaboe  Dagger Rocks  Seal Island  Penguin Island  North Long Island  Lady's Rocks  Elizabeth Bay jetty  North Reef  Possession Island  Albatross Island  Pomona Island  Plumpudding Island  Sinclair Island


                               Site


                                                                 386