
Page 394 - Atlas Sea Birds Ver1
P. 394
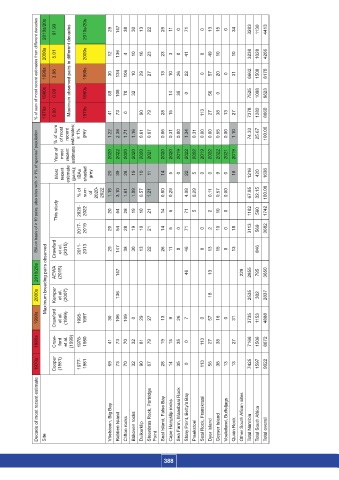
% of sum of most recent estimates from different decades
                       2010s/20s  91.93  2010s/20s  29  147  38  30  13  22  29  11  0  71  0  13  15  0  34  3283  1130  4413


                       2000s  5.01   2000s    12  136  4  10  16  23  23  3  0  41  0  49  10     10  3238  1028  4266


                       1990s  3.06  Maximum observed pairs in different decades  1990s  30  134  106  10  29  27  13  10  26  22  0  57  20  0  31  6662  1508  8170


                       1980s  0.00   1980s    69  108  70  32           14  35  0     56  0        7525  1098  8623


                       1970s  0.00   1970s    41  73  0     90  79  28  15        113  27  38  13  27  7378  1282  8660


                           % of sum   of most   recent   estimates;    ≥ 1%    grey  1.22  2.38  1.71  1.16  0.61  0.67  0.86  0.31  0.00  1.34  0.31  0.00  0.00  0.55  0.00  1.10  74.33  25.67  100.00
                    IBA on basis of ≥ 10 pairs; also sites with  ≥ 1% of species' population


                           Year of   most   recent   estimate  2020  2022  2020  2020  2020  2021  2020  2020  2019  2022  2022  2019  2022  2022  2021  2019


                           Most   recent   estimate   (pairs);   IBAs   shaded   grey  20  39  28  19  10  11  14  5  0  22  5  0  0  9  0  18  1216  420  1636


                                   % of   sum  of   2020-  2022  1.15  3.10  1.61  1.09  0.57  1.21  0.80  0.29     4.08  0.29     0.11  0.57  0.00     67.85  32.15  100.00

                           This study  2020-  2022  20  54  28  19  10  21  14  5     71  5     2  10  0     1182  560  1742


                                   2017-  2011-  2019  2013  20  29  54  147  28  38  19  30  10  13  21  22  14  26  5  11  0  0  71  46  0  0  2  13  10  15  0  0  18  13  3113  569  846  3682


                           Crawford
                             et al.
                               (2015)
                       Maximum breeding pairs observed
                    2010/20s  AEWA   (2015)      147                     46      13         229  2855  795  3650


                    2000s  Kemper   et al.   (2007)        136                   18            2535  302  2837


                    1990s  Crawford   et al.   (1999)  1995-  1997  30  106  109  0  29  27  13  9  26  7  0  57  16  0  31  3735  1153  4888


                    1980s  Craw-  ford   et al.   (1999)  1978-  1980  41  73  70  32  81  79  19  15  35  0  113  27  38  27  7166  1506  8672


                    1970s  Cooper   (1981)  1977-  1981  69  73  70  32  90  67  28  14  35  0  113  56  38  13  13  7425  1597  9022


                    Decade of most recent estimate  Vöelsteen, Big Bay  Robben Island  Clifton rocks  Bakoven rocks  Duikerklip  Steenbras Rock, Partridge   Seal Island, False Bay  Cape Hangklip rocks  Sea Farm, Maasbaai Rock  Stony Point, Betty's Bay  Preekstoel  Seal Rock, Franskraal  Dyer Island  Geyser Island  Voeleiland, Buffeljags  Quoin Rock  Other South Afican sites  Total Namibia  Total South Africa  Total overall


                                                              Point
                       Site


                                                                 388