
Page 506 - Atlas Sea Birds Ver1
P. 506
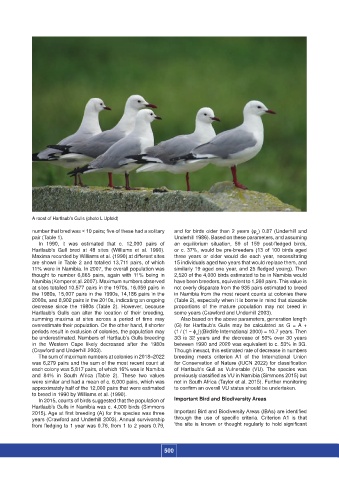
A roost of Hartlaub’s Gulls (photo L Upfold)

                  number that bred was < 10 pairs; five of these had a solitary   and for birds older than 2 years (φ ) 0.87 (Underhill and
                                                                                                 α
                  pair (Table 1).                                   Underhill 1986). Based on these parameters, and assuming
                     In 1990, it was estimated that c. 12,000  pairs of   an  equilibrium  situation,  59  of  159  post-fledged  birds,
                  Hartlaub’s Gull bred  at 48 sites (Williams  et al. 1990).  or c. 37%, would be pre-breeders (13 of 100 birds aged
                  Maxima recorded by Williams et al. (1990) at different sites   three years or older would die each year,  necessitating
                  are shown in Table 2 and totalled 13,711 pairs, of which   15 individuals aged two years that would replace them, and
                  11% were in Namibia. In 2007, the overall population was   similarly 19 aged one year, and 25 fledged young). Then
                  thought to number 6,865 pairs, again  with 11% being  in   2,520 of the 4,000 birds estimated to be in Namibia would
                  Namibia (Kemper et al. 2007). Maximum numbers observed   have been breeders, equivalent to 1,260 pairs. This value is
                  at sites totalled 10,577 pairs in the 1970s, 16,059 pairs in   not overly disparate from the 935 pairs estimated to breed
                  the 1980s, 15,007 pairs in the 1990s, 14,186 pairs in the   in Namibia from the most recent counts at colonies there
                  2000s, and 8,902 pairs in the 2010s, indicating an ongoing   (Table 2), especially when it is borne in mind that sizeable
                  decrease  since  the 1980s  (Table 2). However, because   proportions  of the mature population  may not breed  in
                  Hartlaub’s Gulls can alter the location  of their breeding,   some years (Crawford and Underhill 2003).
                  summing maxima at  sites  across a period of  time may   Also based on the above parameters, generation length
                  overestimate their population. On the other hand, if shorter   (G) for Hartlaub’s Gulls may be calculated  as G =  A +
                  periods result in exclusion of colonies, the population may   (1 / (1 − ϕ ))(Birdlife International 2000) = 10.7 years. Then
                                                                            α
                  be underestimated. Numbers of Hartlaub’s Gulls breeding   3G is 32 years and the decrease of 50% over 30 years
                  in the  Western Cape likely decreased after  the  1980s   between 1990 and 2020 was equivalent to c. 53% in 3G.
                  (Crawford and Underhill 2003).                    Though inexact, this estimated rate of decrease in numbers
                     The sum of maximum numbers at colonies in 2018–2022   breeding meets  criterion  A1  of  the  International Union
                  was 6,279 pairs and the sum of the most recent count at   for Conservation of Nature (IUCN 2022) for classification
                  each colony was 5,817 pairs, of which 16% was in Namibia   of  Hartlaub’s  Gull as Vulnerable  (VU).  The species was
                  and 84% in South  Africa (Table 2).  These two values   previously classified as VU in Namibia (Simmons 2015) but
                  were similar and had a mean of c. 6,000 pairs, which was   not in South Africa (Taylor et al. 2015). Further monitoring
                  approximately half of the 12,000 pairs that were estimated   to confirm an overall VU status should be undertaken.
                  to breed in 1990 by Williams et al. (1990).
                     In 2015, counts of birds suggested that the population of   Important Bird and Biodiversity Areas
                  Hartlaub’s Gulls in Namibia was c. 4,000 birds (Simmons
                  2015). Age at first breeding (A) for the species was three   Important Bird and Biodiversity Areas (IBAs) are identified
                  years (Crawford and Underhill 2003). Annual survivorship   through  the  use  of  specific  criteria.  Criterion  A1  is  that
                  from fledging to 1 year was 0.76, from 1 to 2 years 0.79,   ‘the site is known or thought regularly to hold significant


                                                                 500