
Page 515 - Atlas Sea Birds Ver1
P. 515
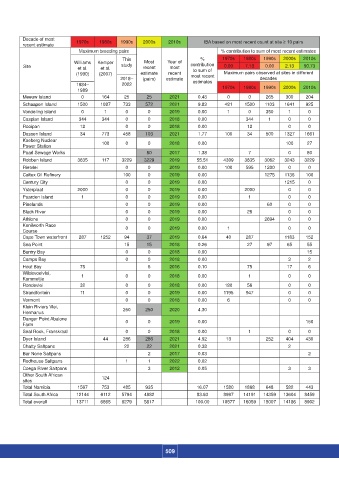
Decade of most     1970s   1980s  1990s   2000s    2010s        IBA based on most recent count at site ≥ 10 pairs
               recent estimate
                                   Maximum breeding pairs                            % contribution to sum of most recent estimates
                                                  This                       %       1970s  1980s  1990s  2000s  2010s
                                 Williams   Kemper        Most    Year of   contribution
                 Site             et al.   et al.   study  recent   most   to sum of   0.00  7.13   0.00   2.13   90.73
                                  (1990)  (2007)        estimate   recent   most recent   Maximum pairs observed at sites in different
                                                 2018–   (pairs)  estimate                        decades
                                  1984–           2022                     estimates
                                                                                     1970s  1980s  1990s  2000s  2010s
                                  1989
               Meeuw Island         0      164     25     25      2021      0.43       0      0     265    300    204
               Schaapen Island    1500    1087    733     572     2021      9.83      481    1500   1103   1641   925
               Vondeling Island     0       1      0       0      2019      0.00       1      0     350     1      0
               Caspian Island      344     344     0       0      2018      0.00             344     1      0      0
               Rooipan             12              0       0      2018      0.00              12            0      0
               Dassen Island       34      773    458     103     2021      1.77      100     34    500    1327   1661
               Koeberg Nuclear             100     0       0      2018      0.00                           100     27
               Power Station
               Paarl Sewage Works                         80      2017      1.38              7             0      80
               Robben Island      3835     117    3229    3229    2019      55.51    4309    3835   3062   3243   3229
               Rietvlei                            0       0      2019      0.00      100    595    1200    0      0
               Caltex Oil Refinery                100      0      2019      0.00                    1275   1136   100
               Century City                        0       0      2019      0.00                           1215    0
               Ysterplaat         2000             0       0      2019      0.00             2000           0      0
               Paarden Island       1              0       0      2019      0.00              1             0      0
               Pinelands                           0       0      2019      0.00                     60     0      0
               Black River                         0       0      2019      0.00              26            0      0
               Athlone                             0       0      2019      0.00                    2694    0      0
               Kenilworth Race                     0       0      2019      0.00       1                    0      0
               Course
               Cape Town waterfront  287  1252     94     37      2019      0.64      40     287           1183   152
               Sea Point                           15     15      2018      0.26              27     97     65     55
               Bantry Bay                          0       0      2018      0.00                                   15
               Camps Bay                           0       0      2018      0.00                            3      2
               Hout Bay            75                      6      2016      0.10              75            17     6
               Wildevoelvlei,       1              0       0      2018      0.00              1             0      0
               Kommetjie
               Rondevlei           32              0       0      2018      0.00      180     56            0      0
               Strandfontein       11              0       0      2019      0.00     1195    947            0      0
               Vermont                             0       0      2018      0.00       6                    0      0
               Klein Riviers Vlei,                250     250     2020      4.30
               Hermanus
               Danger Point Abalone                0       0      2019      0.00                                  150
               Farm
               Seal Rock, Franskraal               0       0      2018      0.00              1             0      0
               Dyer Island                 44     286     286     2021      4.92      13            252    404    430
               Chatty Saltpans                     22     22      2021      0.38                            2
               Bar None Saltpans                           2      2017      0.03                                   2
               Redhouse Saltpans                   1       1      2022      0.02
               Coega River Saltpans                        3      2012      0.05                            3      3
               Other South African         124
               sites
               Total Namibia      1567     753    485     935               16.07    1580    1868   648    582    443
               Total South Africa  12144  6112    5794    4882              83.93    8997   14191  14359  13604   8459
               Total overall      13711   6865    6279    5817              100.00   10577  16059  15007  14186   8902


                                                                 509