Page 340 - Corporate Finance PDF Final new link
P. 340

NPP


                  340                               Corporate Finance                      BRILLIANT’S


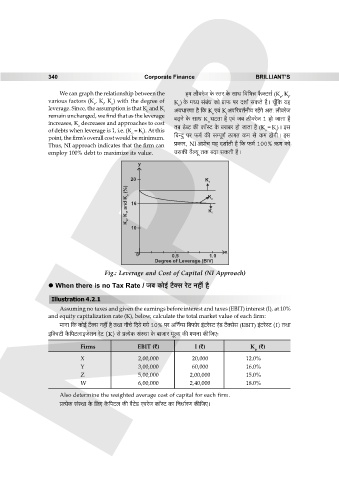
                      We can graph the relationship between the   h_ crdaoO Ho$ ñVa Ho$ gmW {d{^Þ ’¡$³Q>g© (K , K,
                                                                                                   e  i
                  various factors (K , K, K ) with the degree of  K ) Ho$ _Ü` g§~§Y H$mo J«m\$ na Xem© gH$Vo h¡Ÿ& My±{H$ `h
                                  e  i  o                       o
                  leverage. Since, the assumption is that K  and K  AdYmaUm h¡ {H$ K Ed§ K An[adV©Zr` ah|Jo AV: crdaoO
                                                     e     i
                                                                                i
                                                                            e
                  remain unchanged, we find that as the leverage  ~‹T>Zo Ho$ gmW K KQ>Vm h¡ Ed§ O~ crdaoO 1 hmo OmVm h¡
                  increases, K  decreases and approaches to cost          o
                            o                                 V~ S>oãQ> H$s H$m°ñQ> Ho$ ~am~a hmo OmVm h¡ (K = K)Ÿ& Bg
                  of debts when leverage is 1, i.e. (K  = K). At this                         o   i
                                               o   i          {~ÝXw na \$_© H$s gånyU© cmJV H$_ go H$_ hmoJrŸ& Bg
                  point, the firm’s overall cost would be minimum.
                  Thus, NI approach indicates that the firm can  àH$ma, NI AàmoM `h Xem©Vr h¡ {H$ \$_© 100% F$U H$mo
                  employ 100% debt to maximize its value.     CgH$s d¡ë`y VH$ ~‹T>m gH$Vr h¡Ÿ&
                                                  y

                                               20
                                                                         K e
                                              (%)
                                              Ko                          K o
                                              and  16
                                              K ,  i                      K i
                                              ,
                                              K e
                                               10


                                                                                x
                                                 0           0.5           1.0
                                                       Degree of Leverage (B/V)
                                      Fig.: Leverage and Cost of Capital (NI Approach)

                   When there is no Tax Rate / O~ H$moB© Q>¡³g aoQ> Zht h¡

                   Illustration 4.2.1
                      Assuming no taxes and given the earnings before interest and taxes (EBIT) interest (I), at 10%
                  and equity capitalization rate (K), below, calculate the total market value of each firm:
                      ‘mZm {H$ H$moB© Q>¡³g Zht h¡ VWm ZrMo {X¶o J¶o 10% na A{Zª½g {~’$moa B§Q>aoñQ> E§S> Q>¡³gog (EBIT) B§Q>aoñQ> (I) VWm
                  B{³dQ>r H¡${nQ>bmBOoeZ aoQ> (K) go à˶oH$ g§ñWm Ho$ ~mOma ‘yë¶ H$s JUZm H$s{OE…


                             Firms               EBIT (`)            I (`)                 K (`)
                                                                                          e
                             X                    2,00,000          20,000             12.0%
                             Y                    3,00,000          60,000             16.0%
                             Z                    5,00,000          2,00,000           15.0%
                             W                    6,00,000          2,40,000           18.0%
                      Also determine the weighted average cost of capital for each firm.
                      à˶oH$ g§ñWm Ho$ {bE H¡${nQ>b H$s d¡Q>oS> EdaoO H$m°ñQ> H$m {ZYm©aU H$s{OE&
   335   336   337   338   339   340   341   342   343   344   345