
Page 116 - A Complete Guide to Volume Price Analysis: Read the book then read the market
P. 116
Here in Fig 11.15 is an example of a candle pattern on a much longer time frame and is from the monthly chart for Microsoft and shows an
EXTREMELY long congestion phase, but look at the contraction in the price action just prior to the final break out.
The pennant pattern is so called as it resembles a flag on a flagpole. The pattern is created by a series of lower highs above, as the market tries to
rally, coupled with higher lows below. As we can see on the Microsoft chart, here we have a stock which is struggling to break higher, yet is not
prepared to fall. It is this tension in the price action which creates this unique pattern. Again as with all these formations, the law of cause and effect
applies, and in the case of the pennant the longer the tension continues, the more the price action creates what I call a 'coiled spring'.
In other words, the energy stored and built up in the price action is suddenly released in an explosive breakout. The problem is, that with this kind of
pattern, unlike the previous two, there is generally no clue as to which way the price is likely to break. Nevertheless, it is a great pattern for trading
direction-less strategies with options, but for trend trading, we simply have to be patient and wait for the break out.
The last two patterns in this set are reversal signals and ones I am always looking for. The market has risen or fallen, and is now testing support or
resistance. As with the patterns already mentioned, these also occur in all time frames and on all charts and I want to start with some examples of
markets which have run into resistance and kesirn are struggling to move higher.
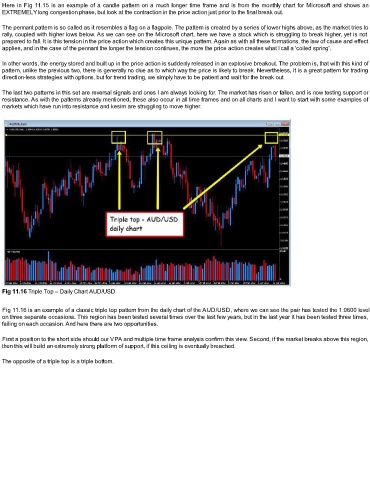
Fig 11.16 Triple Top – Daily Chart AUD/USD
Fig 11.16 is an example of a classic triple top pattern from the daily chart of the AUD/USD, where we can see the pair has tested the 1.0600 level
on three separate occasions. This region has been tested several times over the last few years, but in the last year it has been tested three times,
failing on each occasion. And here there are two opportunities.
First a position to the short side should our VPA and multiple time frame analysis confirm this view. Second, if the market breaks above this region,
then this will build an extremely strong platform of support, if this ceiling is eventually breached.
The opposite of a triple top is a triple bottom.