
Page 117 - A Complete Guide to Volume Price Analysis: Read the book then read the market
P. 117
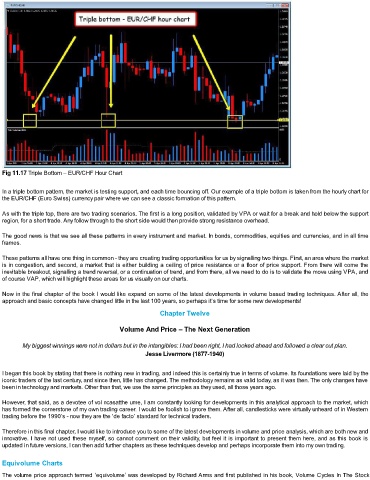
Fig 11.17 Triple Bottom – EUR/CHF Hour Chart

  In a triple bottom pattern, the market is testing support, and each time bouncing off. Our example of a triple bottom is taken from the hourly chart for
  the EUR/CHF (Euro Swiss) currency pair where we can see a classic formation of this pattern.

  As with the triple top, there are two trading scenarios. The first is a long position, validated by VPA or wait for a break and hold below the support
  region, for a short trade. Any follow through to the short side would then provide strong resistance overhead.

  The good news is that we see all these patterns in every instrument and market. In bonds, commodities, equities and currencies, and in all time
  frames.

  These patterns all have one thing in common - they are creating trading opportunities for us by signalling two things. First, an area where the market
  is in congestion, and second, a market that is either building a ceiling of price resistance or a floor of price support. From there will come the
  inevitable breakout, signalling a trend reversal, or a continuation of trend, and from there, all we need to do is to validate the move using VPA, and
  of course VAP, which will highlight these areas for us visually on our charts.

  Now in the final chapter of the book I would like expand on some of the latest developments in volume based trading techniques. After all, the
  approach and basic concepts have changed little in the last 100 years, so perhaps it’s time for some new developments!

                                                      Chapter Twelve

                                         Volume And Price – The Next Generation

        My biggest winnings were not in dollars but in the intangibles: I had been right, I had looked ahead and followed a clear cut plan.
                                                 Jesse Livermore (1877-1940)

  I began this book by stating that there is nothing new in trading, and indeed this is certainly true in terms of volume. Its foundations were laid by the
  iconic traders of the last century, and since then, little has changed. The methodology remains as valid today, as it was then. The only changes have
  been in technology and markets. Other than that, we use the same principles as they used, all those years ago.

  However, that said, as a devotee of vol ncasatthe ume, I am constantly looking for developments in this analytical approach to the market, which
  has formed the cornerstone of my own trading career. I would be foolish to ignore them. After all, candlesticks were virtually unheard of in Western
  trading before the 1990’s - now they are the ‘de facto’ standard for technical traders.

  Therefore in this final chapter, I would like to introduce you to some of the latest developments in volume and price analysis, which are both new and
  innovative. I have not used these myself, so cannot comment on their validity, but feel it is important to present them here, and as this book is
  updated in future versions, I can then add further chapters as these techniques develop and perhaps incorporate them into my own trading.

  Equivolume Charts

  The volume price approach termed ‘equivolume’ was developed by Richard Arms and first published in his book, Volume Cycles In The Stock