
Page 19 - FILE GDP
P. 19
The respondents of this study were 50 respondents (64.9%) who chose the Google Chrome as
a platform to browse the website and 27 respondents (35.1%) used the Safari platform to
browse the website from all respondents.
Section B : Electronic Media
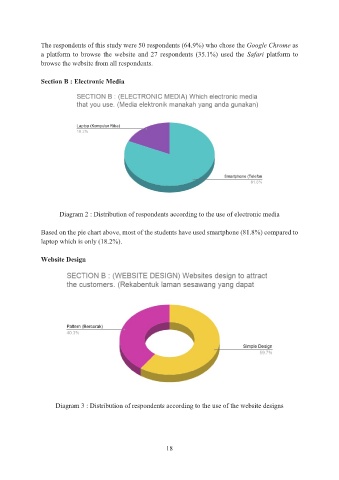
Diagram 2 : Distribution of respondents according to the use of electronic media
Based on the pie chart above, most of the students have used smartphone (81.8%) compared to
laptop which is only (18.2%).
Website Design
Diagram 3 : Distribution of respondents according to the use of the website designs
18