
Page 29 - GBC Summer 2019 Eng
P. 29
RESEARCH REPORT
PRESENTED BY
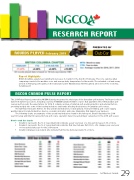
ROUNDS PLAYED February 2019
Report Highlights
British Columbia experienced signi cant decreases in rounds for the month of February. This is no surprise when comparing rounds to the weather score and average daily temperature for the month. The extended cold and snowy periods in February, particularly on the Island and Lower Mainland was felt throughout all sectors of the economy; including golf.
NGCOA CANADA PULSE REPORT
The 2019 Pulse Report, powered by NGCOA Canada, measures the vital signs of the Canadian golf industry. The Report collects data from numerous sources, including a survey of NGCOA Canada member courses that quanti es the 2018 Canadian golf season and forecasts the expectations for 2019. It compiles a range of internal golf operation metrics and external factors, providing insights into some of the leading indicators and trends affecting the business of Canadian golf courses.
The full Report includes metrics for key operational indicators, rounds played, revenue trending, golf course supply, weather impact, related industries, macros economic indicators and some intangibles that impact your business.
The following charts are examples of the operational indicators found in the full report. Chart 1 illustrates the 2018 year-in-review and Chart 2 represents how golf course operators have forecasted major categories for the 2019 golf season.
How to read the charts:
• Column 2 represents the % of respondents who indicate a year-over-year or a forecast increase of 2% or more.
• Column 3 represents the % of respondents who indicate that line item was at (-1% to +1% change) year-over-year
or forecasted status quo for the 2019 season.
• Column 4 displays respondents who indicate that this line item was down 2% or more.
Golf Business Canada
29
