
Page 78 - NEW Armstrong Book - 2
P. 78
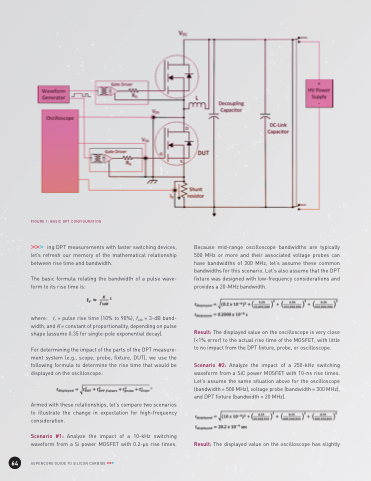
                                  FIGURE 1: BASIC DPT CONFIGURATION
ing DPT measurements with faster switching devices, let’s refresh our memory of the mathematical relationship between rise time and bandwidth.
The basic formula relating the bandwidth of a pulse wave- form to its rise time is:
where: tr = pulse rise time (10% to 90%), f3db = 3-dB band- width, and K = constant of proportionality, depending on pulse shape (assume 0.35 for single-pole exponential decay).
For determining the impact of the parts of the DPT measure- ment system (e.g., scope, probe, fixture, DUT), we use the following formula to determine the rise time that would be displayed on the oscilloscope:
Armed with these relationships, let’s compare two scenarios to illustrate the change in expectation for high-frequency consideration.
Scenario #1: Analyze the impact of a 10-kHz switching waveform from a Si power MOSFET with 0.2-μs rise times.
Because mid-range oscilloscope bandwidths are typically 500 MHz or more and their associated voltage probes can have bandwidths of 300 MHz, let’s assume these common bandwidths for this scenario. Let’s also assume that the DPT fixture was designed with low-frequency considerations and provides a 20-MHz bandwidth.
Result: The displayed value on the oscilloscope is very close (<1% error) to the actual rise time of the MOSFET, with little to no impact from the DPT fixture, probe, or oscilloscope.
Scenario #2: Analyze the impact of a 250-kHz switching waveform from a SiC power MOSFET with 10-ns rise times. Let’s assume the same situation above for the oscilloscope (bandwidth = 500 MHz), voltage probe (bandwidth = 300 MHz), and DPT fixture (bandwidth = 20 MHz).
Result: The displayed value on the oscilloscope has slightly
        64
ASPENCORE GUIDE TO SILICON CARBIDE
