
Page 107 - C:\Users\uromn\Videos\seyyedi pdf\
P. 107
Carbon Dioxide Laser and Aphthous stomatitis
the follow-up on the third, fifth, and seventh day after the 40
treatment, due to self-limiting conditions, fatigue, loss, 35
and healing within 10-14 days, the patient was examined 30 pulse laser group
at the office by the project executor who was not aware 25 continuous laser group
of group types. At these sessions, the size of the aphthous 20 conventional treatment group
lesions was measured in millimeters with a periodontal 15
probe and was compared to the size of the lesion before 10
the treatment. 5
Laser therapy was performed for patients by a laser 0
fellowship with the same condition. The amount of pain age
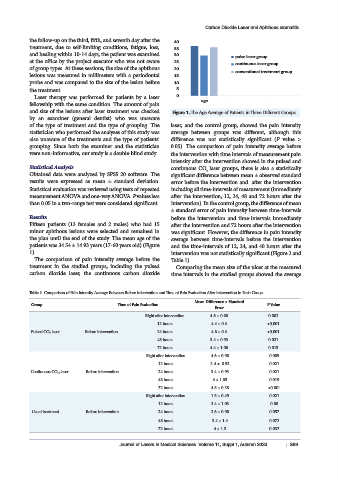
and size of the lesions after laser treatment was checked Figure 1. The Age Average of Patients in Three Different Groups.
by an examiner (general dentist) who was unaware Figure 1. The Age Average of Patients in Three Different Groups.
of the type of treatment and the type of grouping. The laser, and the control group, showed the pain intensity
statistician who performed the analyses of this study was average between groups was different, although this
also unaware of the treatments and the type of patients’ difference was not statistically significant (P value >
grouping. Since both the examiner and the statistician 0.05). The comparison of pain intensity average before
were non-informative, our study is a double-blind study. the intervention with time intervals of measurement pain
intensity after the intervention showed in the pulsed and
Statistical Analysis continuous CO laser groups, there is also a statistically
2
Obtained data were analyzed by SPSS 20 software. The significant difference between mean ± observed standard
results were expressed as mean ± standard deviation. error before the intervention and after the intervention
Statistical evaluation was reviewed using tests of repeated including all time-intervals of measurement (immediately
measurement ANOVA and one-way ANOVA. P values less after the intervention, 12, 24, 48 and 72 hours after the
than 0.05 in a two-range test were considered significant. intervention). In the control group, the difference of mean
± standard error of pain intensity between time-intervals
Results before the intervention and time-intervals immediately
Fifteen patients (13 females and 2 males) who had 15 after the intervention and 72 hours after the intervention
minor aphthous lesions were selected and remained in was significant. However, the difference in pain intensity
the plan until the end of the study. The mean age of the average between time-intervals before the intervention
patients was 34.54 ± 14.93 years (17-60 years old) (Figure and the time-intervals of 12, 24, and 40 hours after the
1). intervention was not statistically significant (Figure 2 and
The comparison of pain intensity average before the Table 1).
treatment in the studied groups, including the pulsed Comparing the mean size of the ulcer at the measured
carbon dioxide laser, the continuous carbon dioxide time intervals in the studied groups showed the average
Table 1. Comparison of Pain Intensity Average Between Before Intervention and Time of Pain Evaluation After Intervention in Each Group
Mean Difference ± Standard
Group Time of Pain Evaluation P Value
Error
Right after intervention 4.6 ± 0.68 0.002
12 hours 4.4 ± 0.4 <0.001
Pulsed CO laser Before intervention 24 hours 4.6 ± 0.4 <0.001
2
48 hours 3.4 ± 0.93 18 0.021
72 hours 4.4 ± 1.08 0.015
Right after intervention 4.6 ± 0.98 0.009
12 hours 3.4 ± 0.93 0.021
Continuous CO laser Before intervention 24 hours 3.4 ± 0.93 0.021
2
48 hours 4 ± 1.05 0.019
72 hours 4.8 ± 0.38 <0.001
Right after intervention 1.8 ± 0.49 0.021
12 hours 2.4 ± 1.03 0.08
Usual treatment Before intervention 24 hours 2.6 ± 0.98 0.057
48 hours 3.4 ± 1.4 0.072
72 hours 4 ± 1.3 0.037
Journal of Lasers in Medical Sciences Volume 11, Suppl 1, Autumn 2020 S69