
Page 169 - C:\Users\uromn\Videos\seyyedi pdf\
P. 169
1054 | SEYYEDI ET AL.
3.2 | Knowledge and attitude fetus; 4 women (4%) disagreed and 23 (24%) had no idea about this
issue.
The mean participants' knowledge score was 2.31 ± 2.01, which was
an indicator of a moderate knowledge level (Table 2).
Regarding the attitude of pregnant women toward whether dental 3.3 | Oral health indices
procedures are harmful to the fetus during pregnancy, 63 women (66%)
agreed, 18 subjects (19%) disagreed, and the other 15 (15%) had no idea. Three indices were used to evaluate the performance of pregnant
It was found that 47 subjects (49%) had a neutral attitude toward dental women in oral hygiene. They were as follows: DMFT, GI, and PI. With
treatment during pregnancy. The mean of pregnant women's attitudes regard to the DMFT Index, 52 participants (54%) had no filled teeth,
score was 2.45 ± 2.21, which was an indicator of neutral attitudes toward indicating that they may not have visited a dentist for examination
oral health care during pregnancy (Table 3). and treatment before their pregnancy. This could indicate poor
Moreover, 69 (72%) agreed that taking dental radiographs, even knowledge of the necessity for dental examination and interventions
with a lead apron and thyroid collar, was potentially harmful to the before planning for pregnancy or that they had no dental caries and
had no need to have any fillings.
The GI scores showed that 51 participants (53%) had mild
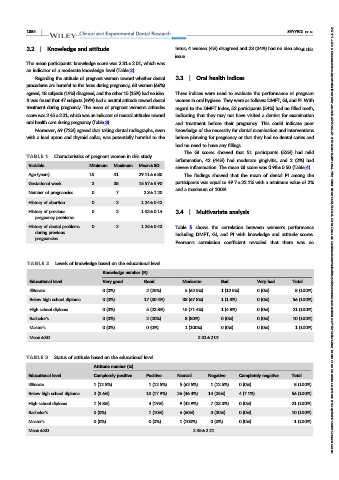
TABLE 1 Characteristics of pregnant women in this study.
inflammation, 42 (44%) had moderate gingivitis, and 2 (2%) had
Variable Minimum Maximum Mean ± SD
severe inflammation. The mean GI score was 0.98 ± 0.50 (Table 4).
Age (years) 15 41 29.11 ± 6.80 The findings showed that the mean of dental PI among the
Gestational week 3 38 15.57 ± 5.90 participants was equal to 49.7 ± 22.1% with a minimum value of 2%
and a maximum of 100%.
Number of pregnancies 0 7 2.3 ± 1.20
History of abortion 0 2 1.24 ± 0.42
History of previous 0 2 1.02 ± 0.14 3.4 | Multivariate analysis
pregnancy problems
History of dental problems 0 2 1.25 ± 0.43 Table 5 shows the correlation between women's performance
during previous including DMFT, GI, and PI with knowledge and attitude scores.
pregnancies 20574347, 2023, 6, Downloaded from https://onlinelibrary.wiley.com/doi/10.1002/cre2.804 by Readcube (Labtiva Inc.), Wiley Online Library on [01/02/2025]. See the Terms and Conditions (https://onlinelibrary.wiley.com/terms-and-conditions) on Wiley Online Library for rules of use; OA articles are governed by the applicable Creative Commons License
Pearson's correlation coefficient revealed that there was no
TABLE 2 Levels of knowledge based on the educational level.
Knowledge number (%)
Educational level Very good Good Moderate Bad Very bad Total
Illiterate 0 (0%) 2 (25%) 5 (62.5%) 1 (12.5%) 0 (0%) 8 (100%)
Below high school diploma 0 (0%) 17 (30.4%) 38 (67.8%) 1 (1.8%) 0 (0%) 56 (100%)
High school diploma 0 (0%) 5 (23.8%) 15 (71.4%) 1 (4.8%) 0 (0%) 21 (100%)
Bachelor's 0 (0%) 2 (20%) 8 (80%) 0 (0%) 0 (0%) 10 (100%)
Master's 0 (0%) 0 (0%) 1 (100%) 0 (0%) 0 (0%) 1 (100%)
Mean ± SD 2.31 ± 2.01
TABLE 3 Status of attitude based on the educational level.
Attitude number (%)
Educational level Completely positive Positive Neutral Negative Completely negative Total
Illiterate 1 (12.5%) 1 (12.5%) 5 (62.5%) 1 (12.5%) 0 (0%) 8 (100%)
Below high school diploma 2 (3.6%) 10 (17.9%) 26 (46.4%) 14 (25%) 4 (7.1%) 56 (100%)
High school diploma 1 (4.8%) 4 (19%) 9 (42.9%) 7 (33.3%) 0 (0%) 21 (100%)
Bachelor's 0 (0%) 1 (10%) 6 (60%) 3 (30%) 0 (0%) 10 (100%)
Master's 0 (0%) 0 (0%) 1 (100%) 0 (0%) 0 (0%) 1 (100%)
Mean ± SD 2.45 ± 2.21