
Page 174 - Theoretical and Practical Interpretation of Investment Attractiveness
P. 174
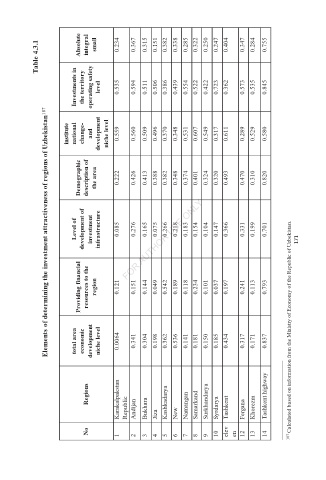
Table 4.3.1   Absolute   integral   small   0.234  0.367  0.315  0.151  0.382  0.338  0.285  0.322  0.250  0.247  0.404  0.347  0.284  0.755


                     Investments in   the territory   operating safety   level   0.535  0.594  0.511  0.506  0.386  0.439  0.554  0.522  0.422  0.723  0.362  0.573  0.535  0.845


             Elements of determining the investment attractiveness of regions of Uzbekistan 187

                   institute   national   change-   and   development   niche level   0.559  0.560  0.509  0.496  0.370  0.348  0.531  0.607  0.549  0.317  0.611  0.289  0.529  0.580


                      Demographic   description of   the area   0.222  0.426  0.413  0.388  0.382  0.348  0.374  0.401  0.324  0.320  0.493  0.470  0.310  0.820


                     Level of   development of   investment   infrastructure

                                0.085  0.276  0.165  0.075  0.266  0.218  0.183  0.154  0.104  0.147  0.366  0.331  0.199  0.701  171


                      Providing financial   resources to the   region   0.121  0.151  0.144  0.049  0.542  0.189  0.118  0.234  0.101  0.037  0.197  0.241  0.113  0.793


                     total area   economic   development   niche level   0.0064  0.341  0.304  0.198  0.362  0.536  0.141  0.181  0.150  0.185  0.434  0.317  0.171  0.837 187  Calculated based on information from the Ministry of Economy of the Republic of Uzbekistan.


                        Regions  Karakalpakstan  Republic   Andijan  Bukhara  Kashkadarya  Namangan  Samarkand  Surkhandarya  Syrdarya  Tashkent  Fergana  Khorezm  highway Tashkent


                        No      1   2  3  Jiza  4  5  New  6  7  8  9  10  elev  en   12  13  14