
Page 103 - JOJAPS_VOL15
P. 103
4.1. Results and Discussion
a. General Description of Oil Palm Plantations in North Sumatra Province
The development of oil palm plantations in North Sumatra Province from year to year when seen as a whole has increased although the increase is
not in large numbers. Commodity of oil palm plantations can be divided into three parts based on age and condition of the plant namely, Immature
Produce Plant (IPP), Productive Plant (PP), unproductive Plant (UP).
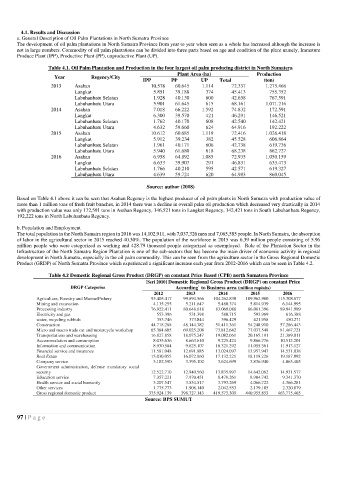
Table 4.1. Oil Palm Plantation and Production in the four largest oil palm producing district in North Sumatera
Plant Area (ha) Production
Year Regency/City
IPP PP UP Total (ton)
2013 Asahan 10.578 60.645 1.114 72.337 1.275.466
Langkat 5.851 39.188 374 45.413 755.352
Labuhanbatu Selatan 1.928 40.130 600 42.658 767.591
Labuhanbatu Utara 5.901 61.645 615 68.161 1.071.216
2014 Asahan 7.018 66.222 1.592 74.832 172.591
Langkat 6.300 39.570 421 46.291 146.521
Labuhanbatu Selatan 1.762 40.170 608 42.540 142.421
Labuhanbatu Utara 4.632 59.660 624 64.916 192.222
2015 Asahan 10.612 60.685 1.119 72.416 1.026.418
Langkat 5.912 39.234 382 45.528 606.864
Labuhanbatu Selatan 1.961 40.171 606 42.738 619.736
Labuhanbatu Utara 5.940 61.680 618 68.238 862.727
2016 Asahan 6.958 64.892 1.085 72.935 1.050.159
Langkat 6.633 39.907 291 46.831 633.473
Labuhanbatu Selatan 1.766 40.210 595 42.571 619.327
Labuhanbatu Utara 4.639 59.724 620 64.983 860.045
Source: author (2018)
Based on Table 4.1 above it can be seen that Asahan Regency is the highest producer of oil palm plants in North Sumatra with production value of
more than 1 million tons of fresh fruit bunches, in 2014 there was a decline in overall palm oil production which decreased very drastically in 2014
with production value was only 172,591 tons in Asahan Regency, 146,521 tons in Langkat Regency, 142,421 tons in South Labuhanbatu Regency,
192,222 tons in North Labuhanbatu Regency.
b. Population and Employment
The total population in the North Sumatra region in 2016 was 14,102,911, with 7,037,326 men and 7,065,585 people. In North Sumatra, the absorption
of labor in the agricultural sector in 2015 reached 40.30%. The population of the workforce in 2015 was 6.39 million people consisting of 5.96
million people who were categorized as working and 428.79 thousand people categorized as unemployed. Role of the Plantation Sector in the
Infrastructure of the North Sumatra Region Plantation is one of the sub-sectors that has become the main driver of economic activity in regional
development in North Sumatra, especially in the oil palm commodity. This can be seen from the agriculture sector in the Gross Regional Domestic
Product (GRDP) of North Sumatra Province which experienced a significant increase each year from 2012-2016 which can be seen in Table 4.2.
Table 4.2 Domestic Regional Gross Product (DRGP) on constant Price Based (CPB) north Sumatera Province
[Seri 2010] Domestic Regional Gross Product (DRGP) on constant Price
DRGP Categories According` to Business area (million rupiahs)
2012 2013 2014 2015 2016
Agriculture, Forestry and Marine/Fishery 95.405.417 99.894.566 104.262.830 109.962.980 115.308.877
Mining and excavation 4.135.255 5.211.647 5.480.374 5.814.939 6.144.995
Processing industry 76.922.411 80.648.618 83.069.088 86.081.396 89.941.989
Electricity and gas 553.396 531.398 580.715 593.969 616.388
water, recycling rubbish 353.746 373.844 396.429 421.958 450.271
Construction 44.718.288 48.144.382 51.411.361 54.248.910 57.286.443
Micro and macro trade car and motorcycle workshop 65.384.605 69.025.208 73.812.642 77.037.549 81.467.721
Transportations and warehousing 16.827.858 18.075.247 19.082.061 20.165.191 21.389.011
Accommodation and consumption 8.035.636 8.663.610 9.225.424 9.866.776 10.512.201
Information and communication 8.930.584 9.625.107 10.321.292 11.055.361 11.913.127
Financial service and insurance 11.581.048 12.691.885 13.024.097 13.957.947 14.531.038
Real Estate 15.030.055 16.072.860 17.132.221 18.119.226 19.187.892
Company service 3.182.590 3.395.102 3.624.699 3.836.940 4.065.405
Government administration, defense mandatory social
security 12.522.710 12.940.560 13.835.997 14.642.062 14.931.577
Education service 7.357.221 7.970.451 8.478.261 8.904.742 9.341.370
Health service and social humanity 3.207.547 3.554.517 3.793.269 4.066.722 4.366.281
Other services 1.775.773 1.908.140 2.042.553 2.179.185 2.320.879
Gross regional domestic product 375.924.139 398.727.143 419.573.309 440.955.853 463.775.465
Source: BPS SUMUT
97 | P a g e