
Page 104 - JOJAPS_VOL15
P. 104
In Table 4.2, it can be seen that the agricultural sector is the sector with the highest PDRB acquisition value in North Sumatra, which means that this
sector still holds considerable control for economic contributors in North Sumatra, which continues to experience a significant increase each year
with a value of 115,308,877 in in 2016. The manufacturing industry sector is also the second highest sector after agriculture with a value of
89,941,989, third place there is a large trade sector with a value of 81,467,721, in the fourth there is a construction sector with a value of 57,286,443,
and fifth there is a sector transportation and warehousing with a value of 21,389,011, for the other twelve sectors only contribute to the province's
income of less than 20 million. Contribution is used as a measure in seeing how big the role of the plantation sector and other sectors is towards
regional development in North Sumatra.
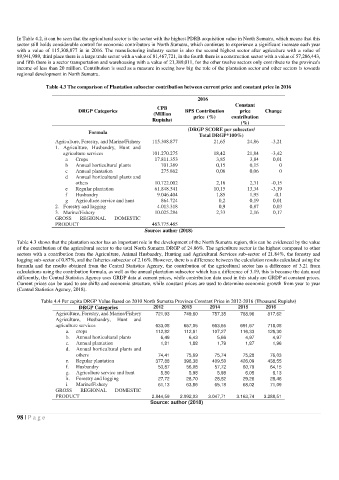
Table 4.3 The comparison of Plantation subsector contribution between current price and constant price in 2016
2016
Constant
CPB
DRGP Categories BPS Contribution price Change
(Million
Rupiahs) price (%) contribution
(%)
(DRGP SCORE per subsector/
Formula
Total DRGP*100%)
Agriculture, Forestry, and Marine/Fishery 115.308.877 21,65 24,86 -3,21
1. Agriculture, Husbandry, Hunt and
agriculture services 101.270.275 18,42 21,84 -3,42
a Crops 17.811.353 3,85 3,84 0,01
b Annual horticultural plants 701.389 0,15 0,15 0
c Annual plantation 275.862 0,06 0,06 0
d Annual horticultural plants and
others 10.722.002 2,16 2,31 -0,15
e Regular plantation 61.848.541 10,15 13,34 -3,19
f Husbandry 9.046.404 1,85 1,95 -0,1
g Agriculture service and hunt 864.724 0,2 0,19 0,01
2. Forestry and logging 4.013.318 0,9 0,87 0,03
3. Marine/Fishery 10.025.284 2,33 2,16 0,17
GROSS REGIONAL DOMESTIC
PRODUCT 463.775.465
Source: author (2018)
Table 4.3 shows that the plantation sector has an important role in the development of the North Sumatra region, this can be evidenced by the value
of the contribution of the agricultural sector to the total North Sumatra DRGP of 24.86%. The agriculture sector is the highest compared to other
sectors with a contribution from the Agriculture, Animal Husbandry, Hunting and Agricultural Services sub-sector of 21.84%, the forestry and
logging sub-sector of 0.87%, and the fisheries subsector of 2.16%. However, there is a difference between the calculation results calculated using the
formula and the results obtained from the Central Statistics Agency, the contribution of the agricultural sector has a difference of 3.21 from
calculations using the contribution formula, as well as the annual plantation subsector which has a difference of 3.19, this is because the data used
differently, the Central Statistics Agency uses GRDP data at current prices, while contribution data used in this study are GRDP at constant prices.
Current prices can be used to see shifts and economic structure, while constant prices are used to determine economic growth from year to year
(Central Statistics Agency, 2018).
Table 4.4 Per capita DRGP Value Based on 2010 North Sumatra Province Constant Price in 2012-2016 (Thousand Rupiahs)
DRGP Categories 2012 2013 2014 2015 2016
Agriculture, Forestry, and Marine/Fishery 721,93 749,60 757,35 788,96 817,62
Agriculture, Husbandry, Hunt and
agriculture services 633,08 657,05 663,65 691,67 718,08
a. crops 112,82 112,61 107,27 116,33 126,30
b. Annual horticultural plants 6,49 6,43 5,66 4,97 4,97
c. Annual plantation 1,81 1,88 1,79 1,87 1,96
d. Annual horticultural plants and
others 74,41 75,69 75,74 75,28 76,03
e. Regular plantation 377,88 398,38 409,50 426,09 438,55
f. Husbandry 53,87 56,08 57,72 60,79 64,15
g. Agriculture service and hunt 5,80 5,98 5,98 6,05 6,13
h. Forestry and logging 27,72 28,70 28,52 29,26 28,46
i. Marine/Fishery 61,13 63,86 65,18 68,02 71,09
GROSS REGIONAL DOMESTIC
PRODUCT 2.844,59 2.992,03 3.047,71 3.163,74 3.288,51
Source: author (2018)
98 | P a g e