
Page 105 - JOJAPS_VOL15
P. 105
From Table 4.4 it can be seen that the annual estate crops sub-sector is the sector that has the highest PDRB value with an average value during 2012-
2016 of Rp. 410.08 and the estate crops sub-sector is the lowest with an average value of Rp. 1.86. Overall the agricultural sector in the past five
years continues to experience a significant increase each year. This is a sign of improving the structure of the global income community in North
Sumatra.
Position of Plantation Sector and Plantation Sub Sector in North Sumatra
The theory of economic bases is divided into two parts, namely the base sector which is an economic sector that can meet the needs of its own region
and can export its industrial products outside the region. Meanwhile, the non-base sector is an economic sector that can only meet the needs of its
own region and tends to import from other regions.
Changes in Position of the Agriculture Sector and Other Sectors
Changes in the position of various sectors are obtained by combining the two previous methods namely the Location Quotient (LQ) and Dynamic
Location Quotient (DLQ) methods. The following are the combined results of the two methods presented in Table 4.5
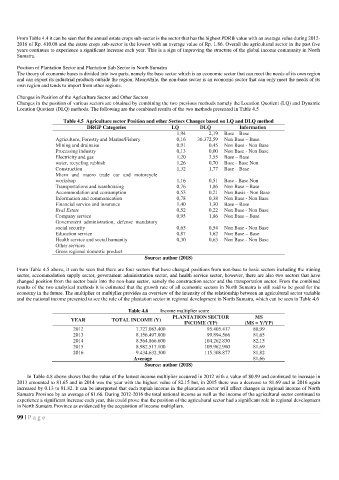
Table 4.5 Agriculture sector Position and other Sectors Changes based on LQ and DLQ method
DRGP Categories LQ DLQ Information
1,94 2,19 Base – Base
Agriculture, Forestry and Marine/Fishery 0,16 36.372,59 Non Base – Base
Mining and drainaise 0,91 0,45 Non Base - Non Base
Processing industry 0,13 0,00 Non Base - Non Base
Electricity and gas 1,20 3,55 Base – Base
water, recycling rubbish 1,26 0,70 Base - Base Non
Construction 1,32 1,77 Base – Base
Micro and macro trade car and motorcycle
workshop 1,16 0,51 Base - Base Non
Transportations and warehousing 0,76 1,86 Non Base – Base
Accommodation and consumption 0,53 0,21 Non Basis - Non Base
Information and communication 0,78 0,38 Non Base - Non Base
Financial service and insurance 1,40 1,30 Base – Base
Real Estate 0,52 0,22 Non Base - Non Base
Company service 0,95 1,86 Non Base – Base
Government administration, defense mandatory
social security 0,65 0,54 Non Base - Non Base
Education service 0,87 1,62 Non Base – Base
Health service and social humanity 0,30 0,63 Non Base - Non Base
Other services
Gross regional domestic product
Source: author (2018)
From Table 4.5 above, it can be seen that there are four sectors that have changed positions from non-base to basic sectors including the mining
sector, accommodation supply sector, government administration sector, and health service sector, however, there are also two sectors that have
changed position from the sector basis into the non-base sector, namely the construction sector and the transportation sector. From the combined
results of the two analytical methods it is estimated that the growth rate of all economic sectors in North Sumatra is still said to be good for the
economy in the future. The multiplier or multiplier provides an overview of the intensity of the relationship between an agricultural sector variable
and the national income presented to see the role of the plantation sector in regional development in North Sumatra, which can be seen in Table 4.6
Table 4.6 Income multiplier score
PLANTATION SECTOR MS
YEAR TOTAL INCOME (Y)
INCOME (YP) (MS = Y/YP)
2012 7.727.083.400 95.405.417 80,99
2013 8.156.497.800 99.894.566 81,65
2014 8.564.866.600 104.262.830 82,15
2015 8.982.517.100 109.962.980 81,69
2016 9.434.632.300 115.308.877 81,82
Average 81,66
Source: author (2018)
In Table 4.8 above shows that the value of the lowest income multiplier occurred in 2012 with a value of 80.99 and continued to increase in
2013 amounted to 81.65 and in 2014 was the year with the highest value of 82.15 but, in 2015 there was a decrease to 81.69 and in 2016 again
increased by 0.13 to 81.82. It can be interpreted that each rupiah income in the plantation sector will affect changes in regional income of North
Sumatra Province by an average of 81.66. During 2012-2016 the total national income as well as the income of the agricultural sector continued to
experience a significant increase each year, this could prove that the position of the agricultural sector had a significant role in regional development
in North Sumatra Province as evidenced by the acquisition of income multipliers.
99 | P a g e