Page 69 - J0JAPS_VOL14
P. 69

Shazrin Eqwal  / JOJAPS – JOURNAL ONLINE JARINGAN PENGAJIAN SENI BINA 0194955501
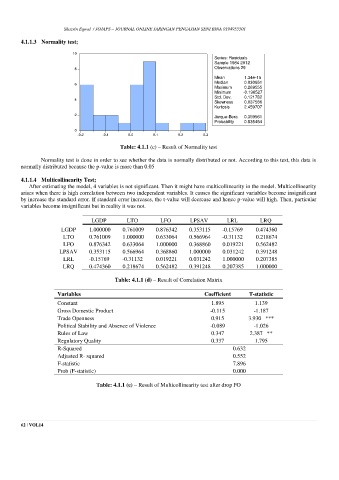
        4.1.1.3  Normality test;

                           10
                                                                            Series: Residuals
                                                                            Sample 1984 2012
                           8                                                Observations 29
                                                                            Mean         1.34e-15
                                                                            Median     0.030651
                           6
                                                                            Maximum    0.269555
                                                                            Minimum   -0.196527
                                                                            Std. Dev.     0.121782
                           4
                                                                            Skewness     0.037586
                                                                            Kurtosis     2.459707
                           2                                                Jarque-Bera   0.359561
                                                                            Probability   0.835454
                           0
                            -0.2     -0.1     0.0      0.1      0.2     0.3

                                           Table: 4.1.1 (c) – Result of Normality test

               Normality test is done in order to see whether the data is normally distributed or not. According to this test, this data is
        normally distributed because the p-value is more than 0.05

        4.1.1.4  Multicollinearity Test;
           After estimating the model, 4 variables is not significant. Then it might have multicollinearity in the model. Multicollinearity
        arises when there is high correlation between two independent variables. It causes the significant variables become insignificant
        by increase the standard error. If standard error increases, the t-value will decrease and hence p-value will high. Then, particular
        variables become insignificant but in reality it was not.

                                 LGDP         LTO        LFO        LPSAV        LRL        LRQ

                       LGDP      1.000000    0.761009    0.876342    0.353115   -0.15769    0.474360
                       LTO       0.761009    1.000000    0.633064    0.566964   -0.31132    0.218674
                       LFO       0.876342    0.633064    1.000000    0.368860    0.019221    0.562482
                      LPSAV      0.353115    0.566964    0.368860    1.000000    0.031242    0.391248
                       LRL      -0.15769    -0.31132    0.019221    0.031242    1.000000    0.207385
                       LRQ       0.474360    0.218674    0.562482    0.391248    0.207385    1.000000

                                         Table: 4.1.1 (d) – Result of Correlation Matrix

                     Variables                                           Coefficient    T-statistic
                     Constant                                              1.895           1.139
                     Gross Domestic Product                                -0.115         -1.187
                     Trade Openness                                        0.915        3.930   ***
                     Political Stability and Absence of Violence           -0.089         -1.026
                     Rules of Law                                          0.347         2.387   **
                     Regulatory Quality                                    0.337           1.795
                     R-Squared                                                     0.632
                     Adjusted R- squared                                           0.552
                     F-statistic                                                   7.896
                     Prob (F-statistic)                                            0.000

                                   Table: 4.1.1 (e) – Result of Multicollinearity test after drop FO


        62 | VOL14
   64   65   66   67   68   69   70   71   72   73   74