
Page 83 - J0JAPS_VOL14
P. 83
Fathan Mubina Dewadi / JOJAPS – JOURNAL ONLINE JARINGAN PENGAJIAN SENI BINA
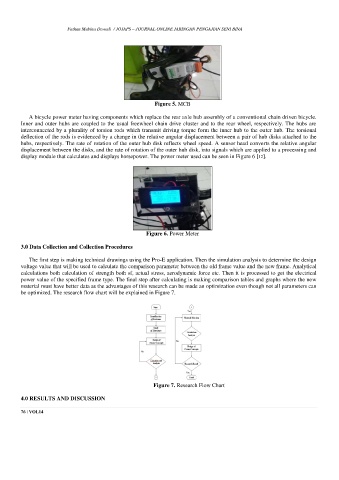
Figure 5. MCB
A bicycle power meter having components which replace the rear axle hub assembly of a conventional chain driven bicycle.
Inner and outer hubs are coupled to the usual freewheel chain drive cluster and to the rear wheel, respectively. The hubs are
interconnected by a plurality of torsion rods which transmit driving torque form the inner hub to the outer hub. The torsional
deflection of the rods is evidenced by a change in the relative angular displacement between a pair of hub disks attached to the
hubs, respectively. The rate of rotation of the outer hub disk reflects wheel speed. A sensor head converts the relative angular
displacement between the disks, and the rate of rotation of the outer hub disk, into signals which are applied to a processing and
display module that calculates and displays horsepower. The power meter used can be seen in Figure 6 [12].
Figure 6. Power Meter
3.0 Data Collection and Collection Procedures
The first step is making technical drawings using the Pro-E application. Then the simulation analysis to determine the design
voltage value that will be used to calculate the comparison parameter between the old frame value and the new frame. Analytical
calculations both calculation of strength both sf, actual stress, aerodynamic force etc. Then it is processed to get the electrical
power value of the specified frame type. The final step after calculating is making comparison tables and graphs where the new
material must have better data as the advantages of this research can be made an optimization even though not all parameters can
be optimized. The research flow chart will be explained in Figure 7.
Figure 7. Research Flow Chart
4.0 RESULTS AND DISCUSSION
76 | VOL14