
Page 17 - annualReport_jmm
P. 17
MANAGEMENT’S DISCUSSION AND ANALYSIS OF FINANCIAL CONDITION
AND RESULTS OF OPERATIONS
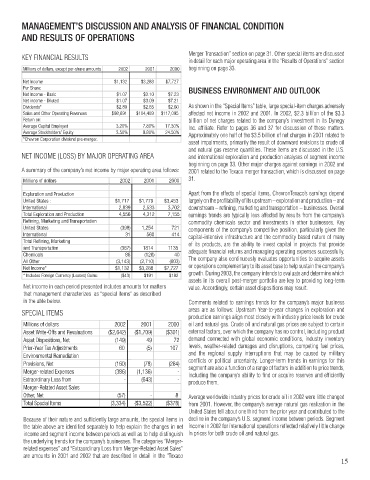
KEY FINANCIAL RESULTS Merger Transaction” section on page 31. Other special items are discussed
in detail for each major operating area in the “Results of Operations” section
Millions of dollars, except per-share amounts 2002 2001 2000 beginning on page 33.
Net Income $1,132 $3,288 $7,727
Per Share: BUSINESS ENVIRONMENT AND OUTLOOK
Net Income - Basic $1.07 $3.10 $7.23
Net income - Diluted $1.07 $3.09 $7.21
Dividends* $2.80 $2.65 $2.60 As shown in the “Special Items” table, large special-item charges adversely
Sales and Other Operating Revenues $98,691 $104,409 $117,095 affected net income in 2002 and 2001. In 2002, $2.3 billion of the $3.3
Return on: billion of net charges related to the company’s investment in its Dynegy
Average Capital Employed 3.20% 7.80% 17.30% Inc. affiliate. Refer to pages 36 and 37 for discussion of these matters.
Average Stockholders’ Equity 3.50% 9.80% 24.50% Approximately one half of the $3.5 billion of net charges in 2001 related to
*Chevron Corporation dividend pre-merger.
asset impairments, primarily the result of downward revisions to crude oil
and natural gas reserve quantities. These items are discussed in the U.S.
NET INCOME (LOSS) BY MAJOR OPERATING AREA and international exploration and production analyses of segment income
beginning on page 33. Other major charges against earnings in 2002 and
A summary of the company’s net income by major operating area follows: 2001 related to the Texaco merger transaction, which is discussed on page
Millions of dollars 2002 2001 2000 31.
Exploration and Production Apart from the effects of special items, ChevronTexaco’s earnings depend
United States : $1,717 $1,779 $3,453 largely on the profitability of its upstream – exploration and production – and
International 2,839 2,533 3,702 downstream – refining, marketing and transportation – businesses. Overall
Total Exploration and Production 4,556 4,312 7,155 earnings trends are typically less affected by results from the company’s
Refining, Marketing and Transportation commodity chemicals sector and investments in other businesses. Key
United States (398) 1,254 721 components of the company’s competitive position, particularly given the
International 31 560 414 capital-intensive infrastructure and the commodity based nature of many
Total Refining, Marketing of its products, are the ability to invest capital in projects that provide
and Transportation (367) 1814 1135 adequate financial returns and managing operating expenses successfully.
Chemicals 86 (128) 40
All Other (3,143) (2,710) (603) The company also continuously evaluates opportunities to acquire assets
Net Income* $1,132 $3,288 $7,727 or operations complementary to its asset base to help sustain the company’s
* Includes Foreign Currency (Losses) Gains: ($43) $191 $182 growth. During 2003, the company intends to evaluate and determine which
assets in its overall post-merger portfolio are key to providing long-term
Net income in each period presented includes amounts for matters value. Accordingly, certain asset dispositions may result.
that management characterizes as “special items” as described
in the able below. Comments related to earnings trends for the company’s major business
SPECIAL ITEMS areas are as follows: Upstream Year-to-year changes in exploration and
production earnings align most closely with industry price levels for crude
Millions of dollars 2002 2001 2000 oil and natural gas. Crude oil and natural gas prices are subject to certain
Asset Write-Offs and Revaluations ($2,642) ($1,709) ($301) external factors, over which the company has no control, including product
Asset Dispositions, Net (149) 49 72 demand connected with global economic conditions, industry inventory
Prior-Year Tax Adjustments 60 (5) 107 levels, weather-related damages and disruptions, competing fuel prices,
Environmental Remediation and the regional supply interruptions that may be caused by military
Provisions, Net (160) (78) (264) conflicts or political uncertainty. Longer-term trends in earnings for this
segment are also a function of a range of factors in addition to price trends,
Merger-related Expenses (386) (1,136) - including the company’s ability to find or acquire reserves and efficiently
Extraordinary Loss from - (643) - produce them.
Merger-Related Asset Sales
Other, Net (57) - 8 Average worldwide industry prices for crude oil in 2002 were little changed
Total Special Items (3,334) ($3,522) ($378) from 2001. However, the company’s average natural gas realization in the
United States fell about one third from the prior year and contributed to the
Because of their nature and sufficiently large amounts, the special items in decline in the company’s U.S. segment income between periods. Segment
the table above are identified separately to help explain the changes in net income in 2002 for international operations reflected relatively little change
income and segment income between periods as well as to help distinguish in prices for both crude oil and natural gas.
the underlying trends for the company’s businesses. The categories “Merger-
related expenses” and “Extraordinary Loss from Merger-Related Asset Sales”
are amounts in 2001 and 2002 that are described in detail in the “Texaco
15