Page 374 - Krugmans Economics for AP Text Book_Neat
P. 374
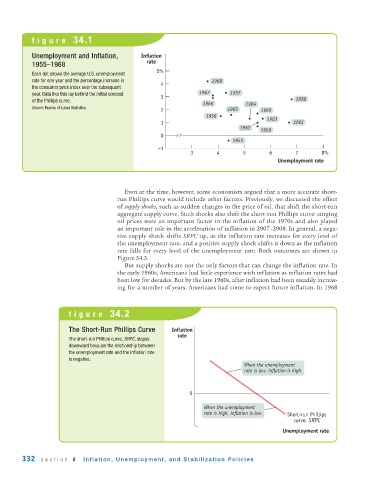
figure 34.1


           Unemployment and Inflation,         Inflation
                                                 rate
           1955–1968
                                                    5%
           Each dot shows the average U.S. unemployment
           rate for one year and the percentage increase in  4        1968
           the consumer price index over the subsequent
           year. Data like this lay behind the initial concept  3  1967     1957
           of the Phillips curve.                                                                 1958
                                                                   1966          1964
           Source: Bureau of Labor Statistics.        2                    1965       1960
                                                                    1956
                                                      1                                 1963     1961
                                                                                1962
                                                                                      1959
                                                      0
                                                                             1955
                                                     –1
                                                               3        4        5       6        7       8%
                                                                                            Unemployment rate


                                          Even at the time, however, some economists argued that a more accurate short -
                                         run Phillips curve would include other factors. Previously, we discussed the effect
                                       of supply shocks, such as sudden changes in the price of oil, that shift the short - run
                                       aggregate supply curve. Such shocks also shift the short - run Phillips curve: surging
                                       oil prices were an important factor in the inflation of the 1970s and also played
                                       an important role in the acceleration of inflation in 2007–2008. In general, a nega-
                                       tive supply shock shifts SRPC up, as the inflation rate increases for every level of
                                       the unemployment rate, and a positive supply shock shifts it down as the inflation
                                       rate falls for every level of the unemployment rate. Both outcomes are shown in
                                       Figure 34.3.
                                          But supply shocks are not the only factors that can change the inflation rate. In
                                       the early 1960s, Americans had little experience with inflation as inflation rates had
                                       been low for decades. But by the late 1960s, after inflation had been steadily increas-
                                       ing for a number of years, Americans had come to expect future inflation. In 1968


                        figure 34.2


                        The Short -Run Phillips Curve    Inflation
                                                           rate
                        The short -run Phillips curve, SRPC, slopes
                        downward  because the relationship between
                        the unemployment rate and the inflation rate
                        is negative.
                                                                                 When the unemployment
                                                                                 rate is low, inflation is high.


                                                               0

                                                                    When the unemployment
                                                                    rate is high, inflation is low.   Short-run Phillips
                                                                                                 curve, SRPC

                                                                                              Unemployment rate


        332   section 6     Inflation, Unemployment, and Stabilization Policies

