Page 379 - Krugmans Economics for AP Text Book_Neat
P. 379
The Natural Rate of Unemployment, Revisited

             Recall the concept of the natural rate of unemployment, the portion of the unemploy-
             ment rate unaffected by the swings of the business cycle. Now we have introduced the
             concept of the NAIRU. How do these two concepts relate to each other?
               The answer is that the NAIRU is another name for the natural rate. The level of un-
             employment the economy “needs” in order to avoid accelerating inflation is equal to
             the natural rate of unemployment.
               In fact, economists estimate the natural rate of unemployment by looking
             for evidence about the NAIRU from the behavior of the inflation rate and the
             unemployment rate over the course of the business cycle. For example, the
             way major European countries learned, to their dismay, that their natural rates
             of unemployment were 9% or more was through unpleasant experience. In the
             late 1980s, and again in the late 1990s, European inflation began to accelerate
             as European unemployment rates, which had been above 9%, began to fall, ap-
             proaching 8%.


              fyi


             The Great Disinflation of the 1980s
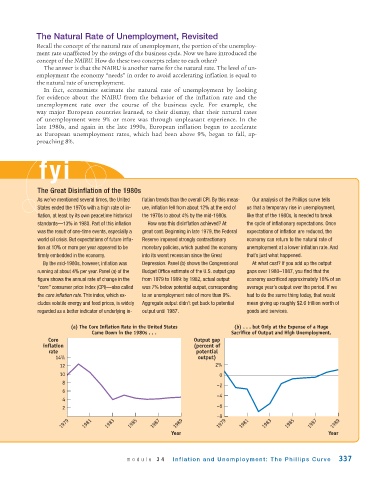
             As we’ve mentioned several times, the United  flation trends than the overall CPI. By this meas-  Our analysis of the Phillips curve tells
             States ended the 1970s with a high rate of in-  ure, inflation fell from about 12% at the end of  us that a temporary rise in unemployment,
             flation, at least by its own peacetime historical  the 1970s to about 4% by the mid - 1980s.  like that of the 1980s, is needed to break
             standards—13% in 1980. Part of this inflation  How was this disinflation achieved? At   the cycle of inflationary expectations. Once
             was the result of one -time events, especially a  great cost. Beginning in late 1979, the Federal  expectations of inflation are reduced, the
             world oil crisis. But expectations of future infla-  Reserve imposed strongly contractionary   economy can return to the natural rate of
             tion at 10% or more per year appeared to be  monetary policies, which pushed the economy  unemployment at a lower inflation rate. And
             firmly embedded in the economy.    into its worst recession since the Great   that’s just what happened.
               By the mid-1980s, however, inflation was  Depression. Panel (b) shows the Congressional  At what cost? If you add up the output
             running at about 4% per year. Panel (a) of the  Budget Office estimate of the U.S. output gap  gaps over 1980–1987, you find that the
             figure shows the annual rate of change in the  from 1979 to 1989: by 1982, actual output   economy sacrificed approximately 18% of an
             “core” consumer price index (CPI)—also called  was 7% below potential output, corresponding  average year’s output over the period. If we
             the core inflation rate. This index, which ex-  to an unemployment rate of more than 9%.   had to do the same thing today, that would
             cludes volatile energy and food prices, is widely  Aggregate output didn’t get back to potential  mean giving up roughly $2.6 trillion worth of
             regarded as a better indicator of underlying in-  output until 1987.  goods and services.

                        (a) The Core Inflation Rate in the United States      (b) . . . but Only at the Expense of a Huge
                               Came Down in the 1980s . . .                  Sacrifice of Output and High Unemployment.
                 Core                                           Output gap
               inflation                                        (percent of
                 rate                                            potential
                   14%                                            output)
                     12                                                2%
                     10                                                  0
                     8
                                                                        –2
                     6
                                                                        –4
                     4
                     2                                                  –6
                                                                        –8
                     1979    1981   1983   1985    1987   1989          1979    1981   1983    1985   1987    1989

                                                         Year                                               Year


                                          module 34       Inflation and Unemployment: The Phillips Curve        337

