Page 381 - Krugmans Economics for AP Text Book_Neat
P. 381
Lenders, however, are less likely to increase spending sharply when the values of the
                                                                                         Debt deflation is the reduction in
             loans they own rise. The overall effect, said Fisher, is that deflation reduces aggregate
                                                                                         aggregate demand arising from the
             demand, deepening an economic slump, which, in a vicious circle, may lead to further  increase in the real burden of
             deflation. The effect of deflation in reducing aggregate demand, known as debt defla-  outstanding debt caused by deflation.
             tion, probably played a significant role in the Great Depression.
                                                                                         There is a zero bound on the nominal
                                                                                         interest rate: it cannot go below zero.
             Effects of Expected Deflation                                               A liquidity trap is a situation in
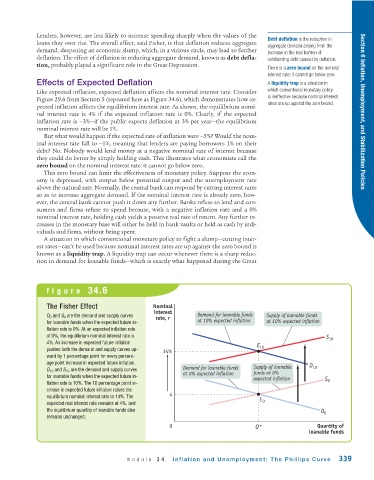
             Like expected inflation, expected deflation affects the nominal interest rate. Consider  which conventional monetary policy
                                                                                         is ineffective because nominal interest
             Figure 29.6 from Section 5 (repeated here as Figure 34.6), which demonstrates how ex-
                                                                                         rates are up against the zero bound.
             pected inflation affects the equilibrium interest rate. As shown, the equilibrium nomi-
             nal interest rate is 4% if the expected inflation rate is 0%. Clearly, if the expected                    Section 6 Inflation, Unemployment, and Stabilization Policies
             inflation rate is −3%—if the public expects deflation at 3% per year—the equilibrium
             nominal interest rate will be 1%.
               But what would happen if the expected rate of inflation were −5%? Would the nom-
             inal interest rate fall to −1%, meaning that lenders are paying borrowers 1% on their
             debt? No. Nobody would lend money at a negative nominal rate of interest because
             they could do better by simply holding cash. This illustrates what economists call the
             zero bound on the nominal interest rate: it cannot go below zero.
               This zero bound can limit the effectiveness of monetary policy. Suppose the econ-
             omy is depressed, with output below potential output and the unemployment rate
             above the natural rate. Normally, the central bank can respond by cutting interest rates
             so as to increase aggregate demand. If the nominal interest rate is already zero, how-
             ever, the central bank cannot push it down any further. Banks refuse to lend and con-
             sumers and firms refuse to spend because, with a negative inflation rate and a 0%
             nominal interest rate, holding cash yields a positive real rate of return. Any further in-
             creases in the monetary base will either be held in bank vaults or held as cash by indi-
             viduals and firms, without being spent.
               A situation in which conventional monetary policy to fight a slump—cutting inter-
             est rates—can’t be used because nominal interest rates are up against the zero bound is
             known as a liquidity trap. A liquidity trap can occur whenever there is a sharp reduc-
             tion in demand for loanable funds—which is exactly what happened during the Great


                figure 34.6


                The Fisher Effect                  Nominal
                                                   interest
                D 0 and S 0 are the demand and supply curves  rate, r  Demand for loanable funds  Supply of loanable funds
                for loanable funds when the expected future in-   at 10% expected inflation  at 10% expected inflation
                flation rate is 0%. At an expected inflation rate
                of 0%, the equilibrium nominal interest rate is                                             S 10
                4%. An increase in expected future inflation
                                                                                     E 10
                pushes both the demand and supply curves up-  14%
                ward by 1 percentage point for every percent-
                age point increase in expected future inflation.                                      D
                D 10 and S 10 are the demand and supply curves  Demand for loanable funds  Supply of loanable  10
                                                             at 0% expected inflation  funds at 0%
                for loanable funds when the expected future in-
                                                                                    expected inflation      S 0
                flation rate is 10%. The 10 percentage point in-
                crease in expected future inflation raises the
                equilibrium nominal interest rate to 14%. The  4
                                                                                      E 0
                expected real interest rate remains at 4%, and
                the equilibrium quantity of loanable funds also                                           D 0
                remains unchanged.
                                                         0                           Q*                  Quantity of
                                                                                                      loanable funds


                                          module 34       Inflation and Unemployment: The Phillips Curve        339

