Page 382 - Krugmans Economics for AP Text Book_Neat
P. 382
figure 34.7


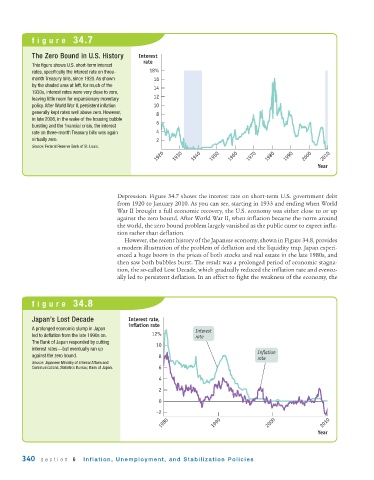
           The Zero Bound in U.S. History     Interest
                                                rate
           This figure shows U.S. short - term interest
           rates, specifically the interest rate on three -   18%
           month Treasury bills, since 1920. As shown   16
           by the shaded area at left, for much of the  14
           1930s, interest rates were very close to zero,
           leaving little room for expansionary monetary  12
           policy. After World War II, persistent inflation  10
           generally kept rates well above zero. However,  8
           in late 2008, in the wake of the housing bubble  6
           bursting and the financial crisis, the interest
           rate on three-month Treasury bills was again  4
           virtually zero.                          2
           Source: Federal Reserve Bank of St. Louis.
                                                    1920  1930  1940  1950  1960  1970  1980  1990  2000  2010

                                                                                                         Year


                                       Depression. Figure 34.7 shows the interest rate on short-term U.S. government debt
                                       from 1920 to January 2010. As you can see, starting in 1933 and ending when World
                                       War II brought a full economic recovery, the U.S. economy was either close to or up
                                       against the zero bound. After World War II, when inflation became the norm around
                                       the world, the zero bound problem largely vanished as the public came to expect infla-
                                       tion rather than deflation.
                                          However, the recent history of the Japanese economy, shown in Figure 34.8, provides
                                       a modern illustration of the problem of deflation and the liquidity trap. Japan experi-
                                       enced a huge boom in the prices of both stocks and real estate in the late 1980s, and
                                       then saw both bubbles burst. The result was a prolonged period of economic stagna-
                                       tion, the so-called Lost Decade, which gradually reduced the inflation rate and eventu-
                                       ally led to persistent deflation. In an effort to fight the weakness of the economy, the


           figure 34.8


           Japan’s Lost Decade             Interest rate,
                                           inflation rate
           A prolonged economic slump in Japan                   Interest
           led to deflation from the late 1990s on.  12%         rate
           The Bank of Japan responded by cutting   10
           interest rates—but eventually ran up
           against the zero bound.                   8                               Inflation
                                                                                     rate
           Source: Japanese Ministry of Internal Affairs and
           Communications, Statistics Bureau; Bank of Japan.  6
                                                     4
                                                     2
                                                     0
                                                    –2
                                                      1980             1990              2000             2010

                                                                                                         Year


        340   section 6     Inflation, Unemployment, and Stabilization Policies

