Page 376 - Krugmans Economics for AP Text Book_Neat
P. 376
figure 34.4


                      Expected Inflation and the         Inflation
                      Short - Run Phillips Curve           rate
                                                              6%
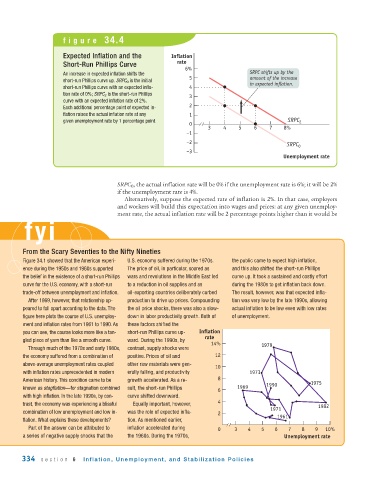
                      An increase in expected inflation shifts the                 SRPC shifts up by the
                                                               5                   amount of the increase
                      short -run Phillips curve up. SRPC 0 is the initial
                      short - run Phillips curve with an expected infla-  4        in expected inflation.
                      tion rate of 0%; SRPC 2 is the short -run Phillips
                                                               3
                      curve with an expected inflation rate of 2%.
                                                               2
                      Each additional percentage point of expected in-
                      flation raises the actual inflation rate at any  1
                      given unemployment rate by 1 percentage point.                           SRPC 2
                                                               0
                                                                     3    4    5    6    7    8%
                                                              –1
                                                              –2
                                                                                               SRPC 0
                                                              –3
                                                                                              Unemployment rate


                                       SRPC 0 , the actual inflation rate will be 0% if the unemployment rate is 6%; it will be 2%
                                       if the unemployment rate is 4%.
                                          Alternatively, suppose the expected rate of inflation is 2%. In that case, employers
                                       and workers will build this expectation into wages and prices: at any given unemploy-
                                       ment rate, the actual inflation rate will be 2 percentage points higher than it would be
         fyi


         From the Scary Seventies to the Nifty Nineties
         Figure 34.1 showed that the American experi-  U.S. economy suffered during the 1970s.   the public came to expect high inflation,
         ence during the 1950s and 1960s supported  The price of oil, in particular, soared as   and this also shifted the short-run Phillips
         the belief in the existence of a short-run Phillips  wars and revolutions in the Middle East led   curve up. It took a sustained and costly effort
         curve for the U.S. economy, with a short -run  to a reduction in oil supplies and as   during the 1980s to get inflation back down.
         trade-off between unemployment and inflation.  oil-exporting countries deliberately curbed  The result, however, was that expected infla-
          After 1969, however, that relationship ap-  production to drive up prices. Compounding  tion was very low by the late 1990s, allowing
         peared to fall apart according to the data. The  the oil price shocks, there was also a slow-  actual inflation to be low even with low rates
         figure here plots the course of U.S. unemploy-  down in labor productivity growth. Both of  of unemployment.
         ment and inflation rates from 1961 to 1990. As  these factors shifted the
         you can see, the course looks more like a tan-  short-run Phillips curve up-  Inflation
                                                                    rate
         gled piece of yarn than like a smooth curve.  ward. During the 1990s, by
                                                                      14%              1979
          Through much of the 1970s and early 1980s,  contrast, supply shocks were
         the economy suffered from a combination of  positive. Prices of oil and  12
         above - average unemployment rates coupled  other raw materials were gen-
                                                                       10
         with inflation rates unprecedented in modern  erally falling, and productivity  1973
         American history. This condition came to be  growth accelerated. As a re-  8
                                                                                        1990           1975
         known as stagflation—for stagnation combined  sult, the short-run Phillips  1969
                                                                        6
         with high inflation. In the late 1990s, by con-  curve shifted downward.
                                                                        4
         trast, the economy was experiencing a blissful  Equally important, however,                     1982
                                                                                         1971
         combination of low unemployment and low in-  was the role of expected infla-  2
         flation. What explains these developments?  tion. As mentioned earlier,            1961
          Part of the answer can be attributed to   inflation accelerated during  0  3  4  5  6  7  8   9  10%
         a series of negative supply shocks that the  the 1960s. During the 1970s,            Unemployment rate


        334   section 6     Inflation, Unemployment, and Stabilization Policies

