Page 413 - Krugmans Economics for AP Text Book_Neat
P. 413
Growth Rates                                                                The Rule of 70 tells us that the time it

             How did the United States manage to produce nearly seven times more per person in  takes a variable that grows gradually over
             2008 than in 1908? A little bit at a time. Long - run economic growth is normally a  time to double is approximately 70 divided
             gradual process in which real GDP per capita grows at most a few percent per year.  by that variable’s annual growth rate.
             From 1908 to 2008, real GDP per capita in the United States increased an average of
             1.9% each year.
               To have a sense of the relationship between the annual growth rate of real GDP per
             capita and the long -run change in real GDP per capita, it’s helpful to keep in mind the                  Section 7 Economic Growth and Productivity
             Rule of 70, a mathematical formula that tells us how long it takes real GDP per
             capita, or any other variable that grows gradually over time, to double. The approxi-
             mate answer is:


                  (37-1) Number of years for variable to double =     70
                                                           Annual growth rate of variable

             (Note that the Rule of 70 can be applied to only a positive growth rate.) So if real
             GDP per capita grows at 1% per year, it will take 70 years to double. If it grows at 2%
             per year, it will take only 35 years to double. Applying the Rule of 70 to the 1.9% aver-
             age growth rate in the United States implies that it should have taken 37 years for
             real GDP per capita to double; it would have taken 111 years—three periods of
             37 years each—for U.S. real GDP per capita to double three times. That is, the Rule
             of 70 implies that over the course of 111 years, U.S. real GDP per capita should have
             increased by a factor of 2 × 2 × 2 = 8. And this does turn out to be a pretty good ap-
             proximation of reality. Between 1890 and 2008—a period of 118 years—real GDP per
             capita rose just about eightfold.
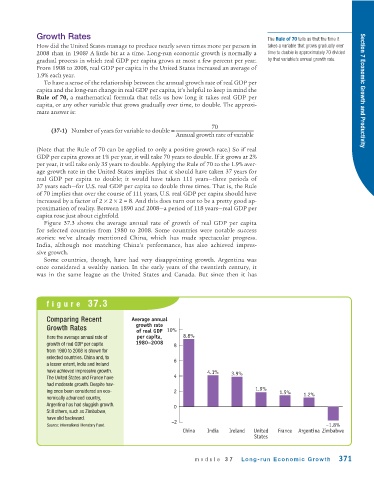
               Figure 37.3 shows the average annual rate of growth of real GDP per capita
             for selected countries from 1980 to 2008. Some countries were notable success
             stories: we’ve already mentioned China, which has made spectacular progress.
             India, although not matching China’s performance, has also achieved impres -
             sive growth.
               Some countries, though, have had very disappointing growth. Argentina was
             once considered a wealthy nation. In the early years of the twentieth century, it
             was in the same league as the United States and Canada. But since then it has


                figure 37.3


                Comparing Recent            Average annual
                                              growth rate
                Growth Rates                            10%
                                              of real GDP
                Here the average annual rate of  per capita,  8.8%
                growth of real GDP per capita   1980–2008  8
                from 1980 to 2008 is shown for
                selected countries. China and, to         6
                a lesser extent, India and Ireland
                have achieved impressive growth.                     4.1%    3.9%
                The United States and France have         4
                had moderate growth. Despite hav-
                ing once been considered an eco-          2                          1.9%   1.5%    1.2%
                nomically advanced country,
                Argentina has had sluggish growth.        0
                Still others, such as Zimbabwe,
                have slid backward.
                                                         –2
                Source: International Monetary Fund.                                                        –1.8%
                                                             China   India  Ireland  United  France  Argentina Zimbabwe
                                                                                    States


                                                                 module 37      Long-run Economic Growth        371

