Page 416 - Krugmans Economics for AP Text Book_Neat
P. 416
Module 37 AP Review

        Solutions appear at the back of the book.
        Check Your Understanding

        1. Why do economists focus on real GDP per capita as a measure  exceed that of the United States in the future if growth rates
           of economic progress rather than on some other measure, such  remained the same? Why or why not?
           as nominal GDP per capita or real GDP?
                                                             3. Although China and India currently have growth rates much
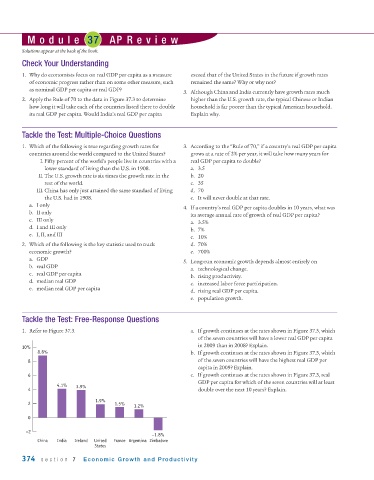
        2. Apply the Rule of 70 to the data in Figure 37.3 to determine  higher than the U.S. growth rate, the typical Chinese or Indian
           how long it will take each of the countries listed there to double  household is far poorer than the typical American household.
           its real GDP per capita. Would India’s real GDP per capita  Explain why.


        Tackle the Test: Multiple-Choice Questions
        1. Which of the following is true regarding growth rates for  3. According to the “Rule of 70,” if a country’s real GDP per capita
           countries around the world compared to the United States?  grows at a rate of 2% per year, it will take how many years for
              I. Fifty percent of the world’s people live in countries with a  real GDP per capita to double?
                lower standard of living than the U.S. in 1908.  a. 3.5
              II. The U.S. growth rate is six times the growth rate in the  b. 20
                rest of the world.                             c. 35
             III. China has only just attained the same standard of living  d. 70
                the U.S. had in 1908.                          e. It will never double at that rate.
           a. I only
                                                             4. If a country’s real GDP per capita doubles in 10 years, what was
           b. II only
                                                               its average annual rate of growth of real GDP per capita?
           c. III only
                                                               a. 3.5%
           d. I and III only
                                                               b. 7%
           e. I, II, and III
                                                               c. 10%
        2. Which of the following is the key statistic used to track  d. 70%
           economic growth?                                    e. 700%
           a. GDP
                                                             5. Long-run economic growth depends almost entirely on
           b. real GDP
                                                               a. technological change.
           c. real GDP per capita
                                                               b. rising productivity.
           d. median real GDP
                                                               c. increased labor force participation.
           e. median real GDP per capita
                                                               d. rising real GDP per capita.
                                                               e. population growth.
        Tackle the Test: Free-Response Questions

        1. Refer to Figure 37.3.                               a. If growth continues at the rates shown in Figure 37.3, which
                                                                  of the seven countries will have a lower real GDP per capita
        10%                                                       in 2009 than in 2008? Explain.
             8.8%                                              b. If growth continues at the rates shown in Figure 37.3, which
          8                                                       of the seven countries will have the highest real GDP per
                                                                  capita in 2009? Explain.
          6                                                    c. If growth continues at the rates shown in Figure 37.3, real
                                                                  GDP per capita for which of the seven countries will at least
                    4.1%  3.9%
          4                                                       double over the next 10 years? Explain.
                                1.9%
          2                            1.5%  1.2%

          0

          –2
                                                   –1.8%
             China  India  Ireland  United  France Argentina Zimbabwe
                                States
        374   section 7     Economic Growth and Productivity

