Page 419 - Krugmans Economics for AP Text Book_Neat
P. 419
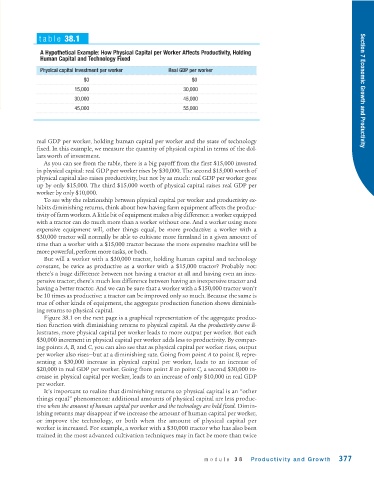
table 38.1

              A Hypothetical Example: How Physical Capital per Worker Affects Productivity, Holding
              Human Capital and Technology Fixed
              Physical capital investment per worker    Real GDP per worker
                            $0                                  $0
                         15,000                              30,000                                                    Section 7 Economic Growth and Productivity
                         30,000                              45,000
                         45,000                              55,000


             real GDP per worker, holding human capital per worker and the state of technology
             fixed. In this example, we measure the quantity of physical capital in terms of the dol-
             lars worth of investment.
               As you can see from the table, there is a big payoff from the first $15,000 invested
             in physical capital: real GDP per worker rises by $30,000. The second $15,000 worth of
             physical capital also raises productivity, but not by as much: real GDP per worker goes
             up by only $15,000. The third $15,000 worth of physical capital raises real GDP per
             worker by only $10,000.
               To see why the relationship between physical capital per worker and productivity ex-
             hibits diminishing returns, think about how having farm equipment affects the produc-
             tivity of farm workers. A little bit of equipment makes a big difference: a worker equipped
             with a tractor can do much more than a worker without one. And a worker using more
             expensive equipment will, other things equal, be more productive: a worker with a
             $30,000 tractor will normally be able to cultivate more farmland in a given amount of
             time than a worker with a $15,000 tractor because the more expensive machine will be
             more powerful, perform more tasks, or both.
               But will a worker with a $30,000 tractor, holding human capital and technology
             constant, be twice as productive as a worker with a $15,000 tractor? Probably not:
             there’s a huge difference between not having a tractor at all and having even an inex-
             pensive tractor; there’s much less difference between having an inexpensive tractor and
             having a better tractor. And we can be sure that a worker with a $150,000 tractor won’t
             be 10 times as productive: a tractor can be improved only so much. Because the same is
             true of other kinds of equipment, the aggregate production function shows diminish-
             ing returns to physical capital.
               Figure 38.1 on the next page is a graphical representation of the aggregate produc-
             tion function with diminishing returns to physical capital. As the productivity curve il-
             lustrates, more physical capital per worker leads to more output per worker. But each
             $30,000 increment in physical capital per worker adds less to productivity. By compar-
             ing points A, B, and C, you can also see that as physical capital per worker rises, output
             per worker also rises—but at a diminishing rate. Going from point A to point B, repre-
             senting a $30,000 increase in physical capital per worker, leads to an increase of
             $20,000 in real GDP per worker. Going from point B to point C, a second $30,000 in-
             crease in physical capital per worker, leads to an increase of only $10,000 in real GDP
             per worker.
               It’s important to realize that diminishing returns to physical capital is an “other
             things equal” phenomenon: additional amounts of physical capital are less produc-
             tive when the amount of human capital per worker and the technology are held fixed. Dimin-
             ishing returns may disappear if we increase the amount of human capital per worker,
             or improve the technology, or both when the amount of physical capital per
             worker is increased. For example, a worker with a $30,000 tractor who has also been
             trained in the most advanced cultivation techniques may in fact be more than twice


                                                                    module 38      Productivity and Growth      377

