Page 423 - Krugmans Economics for AP Text Book_Neat
P. 423
fyi


             The Information Technology Paradox
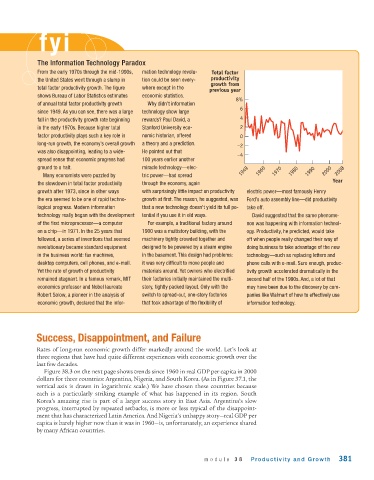
             From the early 1970s through the mid - 1990s,  mation technology revolu-  Total factor
             the United States went through a slump in   tion could be seen every-  productivity
                                                                      growth from
             total factor productivity growth. The figure  where except in the
                                                                      previous year
             shows Bureau of Labor Statistics estimates   economic statistics.
                                                                              8%
             of annual total factor productivity growth   Why didn’t information
                                                                                6
             since 1949. As you can see, there was a large  technology show large
                                                                                4
             fall in the productivity growth rate beginning   rewards? Paul David, a
             in the early 1970s. Because higher total   Stanford University eco-  2
             factor productivity plays such a key role in  nomic historian, offered   0
             long - run growth, the economy’s overall growth  a theory and a prediction.   –2
             was also disappointing, leading to a wide-  He pointed out that
                                                                               –4
             spread sense that economic progress had  100 years earlier another
             ground to a halt.                  miracle technology—elec-        1949  1960  1970  1980  1990  2000  2008
               Many economists were puzzled by   tric power—had spread
                                                                                                              Year
             the slowdown in total factor productivity  through the economy, again
             growth after 1973, since in other ways   with surprisingly little impact on productivity  electric power—most famously Henry
             the era seemed to be one of rapid techno-  growth at first. The reason, he suggested, was  Ford’s auto assembly line—did productivity
             logical progress. Modern information   that a new technology doesn’t yield its full po-  take off.
             technology really began with the development  tential if you use it in old ways.  David suggested that the same phenome-
             of the first microprocessor—a computer   For example, a traditional factory around  non was happening with information technol-
             on a chip—in 1971. In the 25 years that   1900 was a multistory building, with the   ogy. Productivity, he predicted, would take
             followed, a series of inventions that seemed   machinery tightly crowded together and   off when people really changed their way of
             revolutionary became standard equipment   designed to be powered by a steam engine   doing business to take advantage of the new
             in the business world: fax machines,   in the basement. This design had problems:   technology—such as replacing letters and
             desktop computers, cell phones, and e - mail.  it was very difficult to move people and   phone calls with e-mail. Sure enough, produc-
             Yet the rate of growth of productivity   materials around. Yet owners who electrified  tivity growth accelerated dramatically in the
             remained stagnant. In a famous remark, MIT  their factories initially maintained the multi-  second half of the 1990s. And, a lot of that
             economics professor and Nobel laureate  story, tightly packed layout. Only with the  may have been due to the discovery by com-
             Robert Solow, a pioneer in the analysis of   switch to spread - out, one - story factories   panies like Walmart of how to effectively use
             economic growth, declared that the infor-  that took advantage of the flexibility of   information technology.


             Success, Disappointment, and Failure

             Rates of long - run economic growth differ markedly around the world. Let’s look at
             three regions that have had quite different experiences with economic growth over the
             last few decades.
               Figure 38.3 on the next page shows trends since 1960 in real GDP per capita in 2000
             dollars for three countries: Argentina, Nigeria, and South Korea. (As in Figure 37.1, the
             vertical axis is drawn in logarithmic scale.) We have chosen these countries because
             each is a particularly striking example of what has happened in its region. South
             Korea’s amazing rise is part of a larger success story in East Asia. Argentina’s slow
             progress, interrupted by repeated setbacks, is more or less typical of the disappoint-
             ment that has characterized Latin America. And Nigeria’s unhappy story—real GDP per
             capita is barely higher now than it was in 1960—is, unfortunately, an experience shared
             by many African countries.


                                                                    module 38      Productivity and Growth      381

