
Page 428 - Krugmans Economics for AP Text Book_Neat
P. 428
Tackle the Test: Multiple-Choice Questions
1. Which of the following is a source of increased productivity c. Europe
growth? d. East Asia
I. increased physical capital e. Africa
II. increased human capital
4. Which of the following is cited as an important factor
III. technological progress
preventing long-run economic growth in Africa?
a. I only
a. political instability
b. II only
b. lack of property rights
c. III only
c. unfavorable geographic conditions
d. I and II only
d. poor health
e. I, II, and III
e. all of the above
2. Which of the following is an example of physical capital?
5. The “convergence hypothesis”
a. machinery
a. states that differences in real GDP per capita among
b. healthcare
countries widen over time.
c. education
b. states that low levels of real GDP per capita are associated
d. money
with higher growth rates.
e. all of the above
c. states that low levels of real GDP per capita are associated
3. The following statement describes which area of the world? with lower growth rates.
“This area has experienced growth rates unprecedented in d. contradicts the “Rule of 70.”
history and now looks like an economically advanced country.” e. has been proven by evidence from around the world.
a. North America
b. Latin America
Tackle the Test: Free-Response Questions
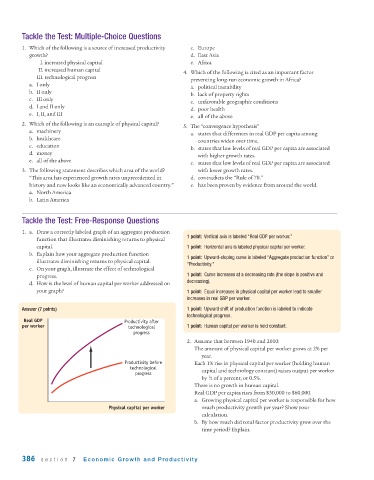
1. a. Draw a correctly labeled graph of an aggregate production
1 point: Vertical axis is labeled “Real GDP per worker.”
function that illustrates diminishing returns to physical
capital. 1 point: Horizontal axis is labeled physical capital per worker.
b. Explain how your aggregate production function
1 point: Upward-sloping curve is labeled “Aggregate production function” or
illustrates diminishing returns to physical capital.
“Productivity.”
c. On your graph, illustrate the effect of technological
progress. 1 point: Curve increases at a decreasing rate (the slope is positive and
d. How is the level of human capital per worker addressed on decreasing).
your graph? 1 point: Equal increases in physical capital per worker lead to smaller
increases in real GDP per worker.
Answer (7 points) 1 point: Upward shift of production function is labeled to indicate
technological progress.
Real GDP Productivity after
per worker technological 1 point: Human capital per worker is held constant.
progress
2. Assume that between 1940 and 2010:
The amount of physical capital per worker grows at 2% per
year.
Productivity before Each 1% rise in physical capital per worker (holding human
technological
progress capital and technology constant) raises output per worker
1
by ⁄2 of a percent, or 0.5%.
There is no growth in human capital.
Real GDP per capita rises from $30,000 to $60,000.
a. Growing physical capital per worker is responsible for how
Physical capital per worker much productivity growth per year? Show your
calculation.
b. By how much did total factor productivity grow over the
time period? Explain.
386 section 7 Economic Growth and Productivity