Page 426 - Krugmans Economics for AP Text Book_Neat
P. 426
fyi


         Are Economies Converging?
         In the 1950s, much of Europe seemed quaint  United States was the richest country in this  than Latin America. But, contrary to the con-
         and backward to American visitors, and Japan  group in 1955 and had the slowest rate of  vergence hypothesis, the Western European
         seemed very poor. Today, a visitor to Paris   growth. Japan and Spain were the poorest  regional economy grew more quickly over
         or Tokyo sees a city that looks about as rich   countries in 1955 and had the fastest rates of  the next 53 years, widening the gap between
         as New York. Although real GDP per capita is  growth. These data suggest that the conver-  the regions.
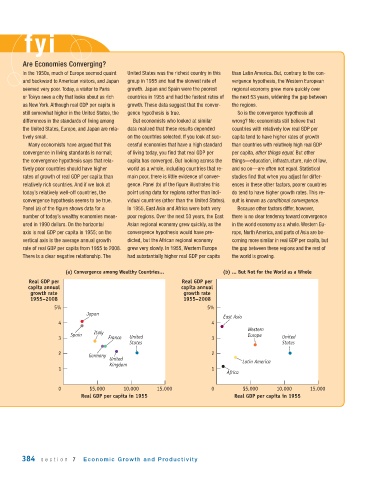
         still somewhat higher in the United States, the  gence hypothesis is true.  So is the convergence hypothesis all
         differences in the standards of living among  But economists who looked at similar   wrong? No: economists still believe that
         the United States, Europe, and Japan are rela-  data realized that these results depended   countries with relatively low real GDP per
         tively small.                     on the countries selected. If you look at suc-  capita tend to have higher rates of growth
          Many economists have argued that this  cessful economies that have a high standard  than countries with relatively high real GDP
         convergence in living standards is normal;   of living today, you find that real GDP per  per capita, other things equal. But other
         the convergence hypothesis says that rela-  capita has converged. But looking across the  things—education, infrastructure, rule of law,
         tively poor countries should have higher   world as a whole, including countries that re-  and so on—are often not equal. Statistical
         rates of growth of real GDP per capita than  main poor, there is little evidence of conver-  studies find that when you adjust for differ-
         relatively rich countries. And if we look at  gence. Panel (b) of the figure illustrates this  ences in these other factors, poorer countries
         today’s relatively well - off countries, the   point using data for regions rather than indi-  do tend to have higher growth rates. This re-
         convergence hypothesis seems to be true.  vidual countries (other than the United States).  sult is known as conditional convergence.
         Panel (a) of the figure shows data for a   In 1955, East Asia and Africa were both very  Because other factors differ, however,
         number of today’s wealthy economies meas-  poor regions. Over the next 53 years, the East  there is no clear tendency toward convergence
         ured in 1990 dollars. On the horizontal   Asian regional economy grew quickly, as the  in the world economy as a whole. Western Eu-
         axis is real GDP per capita in 1955; on the  convergence hypothesis would have pre-  rope, North America, and parts of Asia are be-
         vertical axis is the average annual growth   dicted, but the African regional economy   coming more similar in real GDP per capita, but
         rate of real GDP per capita from 1955 to 2008.  grew very slowly. In 1955, Western Europe  the gap between these regions and the rest of
         There is a clear negative relationship. The  had substantially higher real GDP per capita  the world is growing.

                      (a) Convergence among Wealthy Countries...          (b) ... But Not for the World as a Whole
          Real GDP per                                       Real GDP per
          capita annual                                     capita annual
           growth rate                                       growth rate
           1955–2008                                         1955–2008
                   5%                                                5%
                             Japan
                                                                          East Asia
                    4                                                 4
                                                                                  Western
                                Italy
                    3   Spain       France  United                    3           Europe     United
                                           States                                            States
                    2         Germany                                 2
                                     United                                     Latin America
                                     Kingdom
                    1                                                 1
                                                                           Africa

                    0         $5,000     10,000     15,000            0         $5,000      10,000    15,000
                            Real GDP per capita in 1955                       Real GDP per capita in 1955


        384   section 7     Economic Growth and Productivity

