Page 420 - Krugmans Economics for AP Text Book_Neat
P. 420
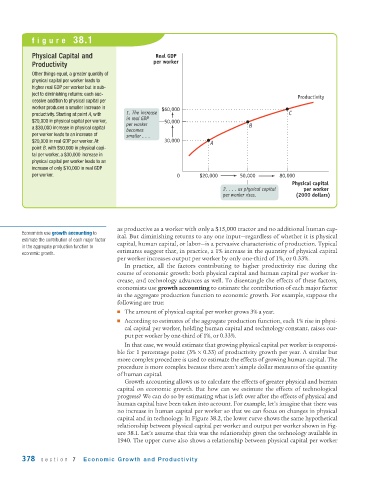
figure 38.1


           Physical Capital and                     Real GDP
                                                   per worker
           Productivity
           Other things equal, a greater quantity of
           physical capital per worker leads to
           higher real GDP per worker but is sub-
           ject to diminishing returns: each suc-
                                                                                                  Productivity
           cessive addition to physical capital per
           worker produces a smaller increase in      $60,000
           productivity. Starting at point A, with  1. The increase                             C
                                          in real GDP
           $20,000 in physical capital per worker,     50,000
                                          per worker                              B
           a $30,000 increase in physical capital
                                          becomes
           per worker leads to an increase of  smaller . . .
           $20,000 in real GDP per worker. At          30,000         A
           point B, with $50,000 in physical capi-
           tal per worker, a $30,000 increase in
           physical capital per worker leads to an
           increase of only $10,000 in real GDP
           per worker.                                     0      $20,000       50,000       80,000
                                                                                                 Physical capital
                                                                          2. . . . as physical capital  per worker
                                                                          per worker rises.       (2000 dollars)


                                       as productive as a worker with only a $15,000 tractor and no additional human cap-
        Economists use growth accounting to
                                       ital. But diminishing returns to any one input—regardless of whether it is physical
        estimate the contribution of each major factor
                                       capital, human capital, or labor—is a pervasive characteristic of production. Typical
        in the aggregate production function to
                                       estimates suggest that, in practice, a 1% increase in the quantity of physical capital
        economic growth.
                                       per worker increases output per worker by only one-third of 1%, or 0.33%.
                                          In practice, all the factors contributing to higher productivity rise during the
                                       course of economic growth: both physical capital and human capital per worker in-
                                       crease, and technology advances as well. To disentangle the effects of these factors,
                                       economists use growth accounting to estimate the contribution of each major factor
                                       in the aggregate production function to economic growth. For example, suppose the
                                       following are true:
                                       ■ The amount of physical capital per worker grows 3% a year.
                                       ■ According to estimates of the aggregate production function, each 1% rise in physi-
                                          cal capital per worker, holding human capital and technology constant, raises out-
                                          put per worker by one-third of 1%, or 0.33%.
                                          In that case, we would estimate that growing physical capital per worker is responsi-
                                       ble for 1 percentage point (3% × 0.33) of productivity growth per year. A similar but
                                       more complex procedure is used to estimate the effects of growing human capital. The
                                       procedure is more complex because there aren’t simple dollar measures of the quantity
                                       of human capital.
                                          Growth accounting allows us to calculate the effects of greater physical and human
                                       capital on economic growth. But how can we estimate the effects of technological
                                       progress? We can do so by estimating what is left over after the effects of physical and
                                       human capital have been taken into account. For example, let’s imagine that there was
                                       no increase in human capital per worker so that we can focus on changes in physical
                                       capital and in technology. In Figure 38.2, the lower curve shows the same hypothetical
                                       relationship between physical capital per worker and output per worker shown in Fig-
                                       ure 38.1. Let’s assume that this was the relationship given the technology available in
                                       1940. The upper curve also shows a relationship between physical capital per worker

        378   section 7     Economic Growth and Productivity

