
Page 442 - Krugmans Economics for AP Text Book_Neat
P. 442
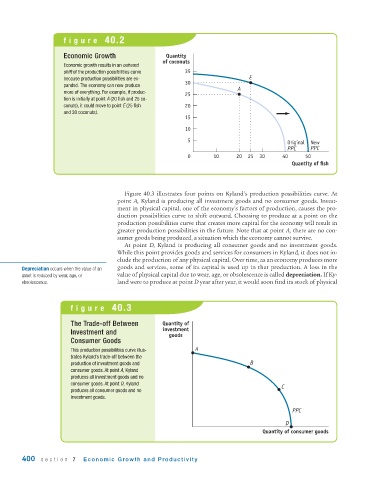
figure 40.2


                      Economic Growth                  Quantity
                                                      of coconuts
                      Economic growth results in an outward
                      shift of the production possibilities curve  35
                      because production possibilities are ex-                     E
                      panded. The economy can now produce     30
                                                                               A
                      more of everything. For example, if produc-  25
                      tion is initially at point A (20 fish and 25 co-
                      conuts), it could move to point E (25 fish  20
                      and 30 coconuts).
                                                              15

                                                              10
                                                              5                                Original  New
                                                                                               PPC     PPC
                                                              0        10     20  25  30     40      50
                                                                                                 Quantity of fish


                                          Figure 40.3 illustrates four points on Kyland’s production possibilities curve. At
                                       point A, Kyland is producing all investment goods and no consumer goods. Invest-
                                       ment in physical capital, one of the economy’s factors of production, causes the pro-
                                       duction possibilities curve to shift outward. Choosing to produce at a point on the
                                       production possibilities curve that creates more capital for the economy will result in
                                       greater production possibilities in the future. Note that at point A, there are no con-
                                       sumer goods being produced, a situation which the economy cannot survive.
                                          At point D, Kyland is producing all consumer goods and no investment goods.
                                       While this point provides goods and services for consumers in Kyland, it does not in-
                                       clude the production of any physical capital. Over time, as an economy produces more
        Depreciation occurs when the value of an  goods and services, some of its capital is used up in that production. A loss in the
        asset is reduced by wear, age, or  value of physical capital due to wear, age, or obsolescence is called depreciation. If Ky-
        obsolescence.                  land were to produce at point D year after year, it would soon find its stock of physical


                        figure 40.3

                        The Trade-off Between         Quantity of
                        Investment and                investment
                                                        goods
                        Consumer Goods
                        This production possibilities curve illus-  A
                        trates Kyland’s trade-off between the
                        production of investment goods and                         B
                        consumer goods. At point A, Kyland
                        produces all investment goods and no
                        consumer goods. At point D, Kyland
                                                                                             C
                        produces all consumer goods and no
                        investment goods.
                                                                                                 PPC

                                                                                              D
                                                                                       Quantity of consumer goods


        400   section 7     Economic Growth and Productivity