
Page 446 - Krugmans Economics for AP Text Book_Neat
P. 446
4. In the aggregate demand-aggregate supply model, long-run 5. Which of the following is listed among the key sources of
economic growth is shown by a growth in potential output?
a. leftward shift of the aggregate demand curve. a. expansionary fiscal policy
b. rightward shift of the aggregate demand curve. b. expansionary monetary policy
c. rightward shift of the long-run aggregate supply curve. c. a rightward shift of the short-run aggregate supply curve
d. rightward shift of the short-run aggregate supply curve. d. investment in human capital
e. leftward shift of the short-run aggregate supply curve. e. both a and b
Tackle the Test: Free-Response Questions
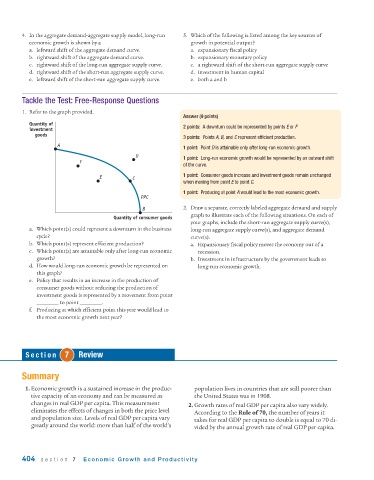
1. Refer to the graph provided.
Answer (9 points)
Quantity of
investment 2 points: A downturn could be represented by points E or F
goods
3 points: Points A, B, and C represent efficient production.
A
1 point: Point D is attainable only after long-run economic growth.
D 1 point: Long-run economic growth would be represented by an outward shift
F
of the curve.
E C 1 point: Consumer goods increase and investment goods remain unchanged
when moving from point E to point C.
1 point: Producing at point A would lead to the most economic growth.
PPC
B 2. Draw a separate, correctly labeled aggregate demand and supply
graph to illustrate each of the following situations. On each of
Quantity of consumer goods
your graphs, include the short-run aggregate supply curve(s),
a. Which point(s) could represent a downturn in the business long-run aggregate supply curve(s), and aggregate demand
cycle? curve(s).
b. Which point(s) represent efficient production? a. Expansionary fiscal policy moves the economy out of a
c. Which point(s) are attainable only after long-run economic recession.
growth? b. Investment in infrastructure by the government leads to
d. How would long-run economic growth be represented on long-run economic growth.
this graph?
e. Policy that results in an increase in the production of
consumer goods without reducing the production of
investment goods is represented by a movement from point
to point .
f. Producing at which efficient point this year would lead to
the most economic growth next year?
Section 7 Review
Summary
1. Economic growth is a sustained increase in the produc- population lives in countries that are still poorer than
tive capacity of an economy and can be measured as the United States was in 1908.
changes in real GDP per capita. This measurement 2. Growth rates of real GDP per capita also vary widely.
eliminates the effects of changes in both the price level According to the Rule of 70, the number of years it
and population size. Levels of real GDP per capita vary takes for real GDP per capita to double is equal to 70 di-
greatly around the world: more than half of the world’s vided by the annual growth rate of real GDP per capita.
404 section 7 Economic Growth and Productivity