Page 449 - Krugmans Economics for AP Text Book_Neat
P. 449
Section 7  Summary


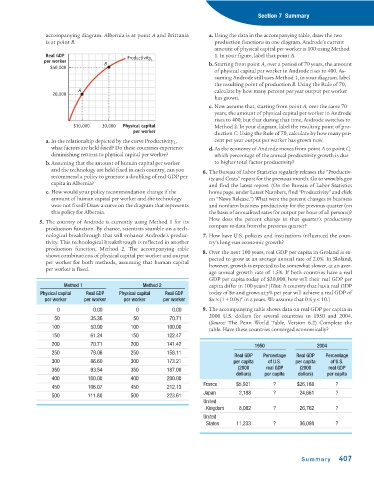
                accompanying diagram. Albernia is at point A and Brittania  a. Using the data in the accompanying table, draw the two
                is at point B.                                         production functions in one diagram. Androde’s current
                                                                       amount of physical capital per worker is 100 using Method
                Real GDP                   Productivity                1. In your figure, label that point A.
               per worker                         1
                                   B                                 b.Starting from point A, over a period of 70 years, the amount
                 $40,000
                                                                       of physical capital per worker in Androde rises to 400. As-
                                                                       suming Androde still uses Method 1, in your diagram, label
                                                                       the resulting point of production B. Using the Rule of 70,
                           A                                           calculate by how many percent per year output per worker
                  20,000
                                                                       has grown.
                                                                     c. Now assume that, starting from point A, over the same 70
                                                                       years, the amount of physical capital per worker in Androde
                                                                       rises to 400, but that during that time, Androde switches to
                         $10,000  30,000  Physical capital             Method 2. In your diagram, label the resulting point of pro-
                                             per worker                duction C. Using the Rule of 70, calculate by how many per-
                a. In the relationship depicted by the curve Productivity 1 ,  cent per year output per worker has grown now.
                  what factors are held fixed? Do these countries experience  d.As the economy of Androde moves from point A to point C,
                  diminishing returns to physical capital per worker?  which percentage of the annual productivity growth is due
                b.Assuming that the amount of human capital per worker  to higher total factor productivity?
                  and the technology are held fixed in each country, can you  6. The Bureau of Labor Statistics regularly releases the “Productiv-
                  recommend a policy to generate a doubling of real GDP per  ity and Costs” report for the previous month. Go to www.bls.gov
                  capita in Albernia?                                and find the latest report. (On the Bureau of Labor Statistics
                c. How would your policy recommendation change if the  home page, under Latest Numbers, find “Productivity” and click
                  amount of human capital per worker and the technology  on “News Release.”) What were the percent changes in business
                  were not fixed? Draw a curve on the diagram that represents  and nonfarm business productivity for the previous quarter (on
                  this policy for Albernia.                          the basis of annualized rates for output per hour of all persons)?
                                                                     How does the percent change in that quarter’s productivity
              5. The country of Androde is currently using Method 1 for its
                production function. By chance, scientists stumble on a tech-  compare to data from the previous quarter?
                nological breakthrough that will enhance Androde’s produc-  7. How have U.S. policies and institutions influenced the coun-
                tivity. This technological breakthrough is reflected in another  try’s long -run economic growth?
                production function, Method 2. The accompanying table  8. Over the next 100 years, real GDP per capita in Groland is ex-
                shows combinations of physical capital per worker and output  pected to grow at an average annual rate of 2.0%. In Sloland,
                per worker for both methods, assuming that human capital  however, growth is expected to be somewhat slower, at an aver-
                per worker is fixed.
                                                                     age annual growth rate of 1.5%. If both countries have a real
                                                                     GDP per capita today of $20,000, how will their real GDP per
                      Method 1                  Method 2             capita differ in 100 years? [Hint: A country that has a real GDP
              Physical capital   Real GDP   Physical capital   Real GDP  today of $x and grows at y% per year will achieve a real GDP of
                                                                                z
                per worker   per worker   per worker  per worker     $x × (1 + 0.0y) in z years. We assume that 0 ≤ y < 10.]
                    0           0.00          0          0.00      9. The accompanying table shows data on real GDP per capita in
                                                                     2000 U.S. dollars for several countries in 1950 and 2004.
                   50          35.36         50          70.71
                                                                     (Source: The Penn World Table, Version 6.2) Complete the
                  100          50.00        100         100.00
                                                                     table. Have these countries converged economically?
                  150          61.24        150         122.47
                  200          70.71        200         141.42                      1950                 2004
                  250          79.06        250         158.11
                                                                              Real GDP  Percentage  Real GDP  Percentage
                  300          86.60        300         173.21               per capita  of U.S.  per capita  of U.S.
                  350          93.54        350         187.08                 (2000    real GDP   (2000    real GDP
                                                                              dollars)  per capita  dollars)  per capita
                  400         100.00        400         200.00
                                                                    France    $5,921      ?       $26,168      ?
                  450         106.07        450         212.13
                                                                    Japan      2,188      ?        24,661      ?
                  500         111.80        500         223.61
                                                                    United
                                                                     Kingdom   8,082      ?        26,762      ?
                                                                    United
                                                                     States   11,233      ?        36,098      ?


                                                                                                    Summary     407

