Page 454 - Krugmans Economics for AP Text Book_Neat
P. 454
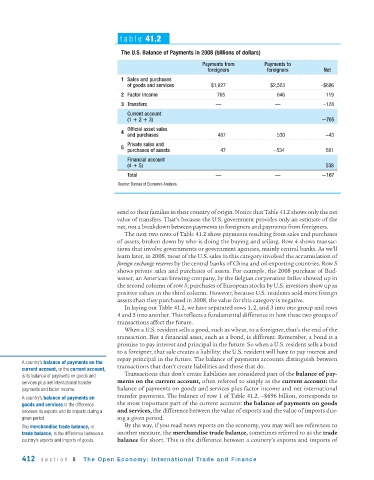
table 41.2

                                         The U.S. Balance of Payments in 2008 (billions of dollars)

                                                                   Payments from        Payments to
                                                                     foreigners         foreigners         Net
                                         1 Sales and purchases
                                           of goods and services      $1,827              $2,523          −$696
                                         2 Factor income                765                 646             119
                                         3 Transfers                    —                  —               −128
                                           Current account
                                           (1   2   3)                                                     705
                                           Official asset sales
                                         4
                                           and purchases                487                 530             −43
                                           Private sales and
                                         5
                                           purchases of assets           47                −534             581
                                           Financial account
                                           (4   5)                                                          538
                                           Total                        —                  —               167
                                       Source: Bureau of Economic Analysis.


                                       send to their families in their country of origin. Notice that Table 41.2 shows only the net
                                       value of transfers. That’s because the U.S. government provides only an estimate of the
                                       net, not a breakdown between payments to foreigners and payments from foreigners.
                                          The next two rows of Table 41.2 show payments resulting from sales and purchases
                                       of assets, broken down by who is doing the buying and selling. Row 4 shows transac-
                                       tions that involve governments or government agencies, mainly central banks. As we’ll
                                       learn later, in 2008, most of the U.S. sales in this category involved the accumulation of
                                       foreign exchange reserves by the central banks of China and oil-exporting countries. Row 5
                                       shows private sales and purchases of assets. For example, the 2008 purchase of Bud-
                                       weiser, an American brewing company, by the Belgian corporation InBev showed up in
                                       the second column of row 5; purchases of European stocks by U.S. investors show up as
                                       positive values in the third column. However, because U.S. residents sold more foreign
                                       assets than they purchased in 2008, the value for this category is negative.
                                          In laying out Table 41.2, we have separated rows 1, 2, and 3 into one group and rows
                                       4 and 5 into another. This reflects a fundamental difference in how these two groups of
                                       transactions affect the future.
                                          When a U.S. resident sells a good, such as wheat, to a foreigner, that’s the end of the
                                       transaction. But a financial asset, such as a bond, is different. Remember, a bond is a
                                       promise to pay interest and principal in the future. So when a U.S. resident sells a bond
                                       to a foreigner, that sale creates a liability: the U.S. resident will have to pay interest and
                                       repay principal in the future. The balance of payments accounts distinguish between
        A country’s balance of payments on the
                                       transactions that don’t create liabilities and those that do.
        current account, or the current account,
                                          Transactions that don’t create liabilities are considered part of the balance of pay-
        is its balance of payments on goods and
        services plus net international transfer  ments on the current account, often referred to simply as the current account: the
        payments and factor income.    balance of payments on goods and services plus factor income and net international
                                       transfer payments. The balance of row 1 of Table 41.2, −$696 billion, corresponds to
        A country’s balance of payments on
        goods and services is the difference  the most important part of the current account: the balance of payments on goods
        between its exports and its imports during a  and services, the difference between the value of exports and the value of imports dur-
        given period.                  ing a given period.
        The merchandise trade balance, or  By the way, if you read news reports on the economy, you may well see references to
        trade balance, is the difference between a  another measure, the merchandise trade balance, sometimes referred to as the trade
        country’s exports and imports of goods.  balance for short. This is the difference between a country’s exports and imports of

        412   section 8     The Open Economy: Inter national Trade and Finance

