Page 457 - Krugmans Economics for AP Text Book_Neat
P. 457
Equation 41-3 is equivalent to Equation 41-1: the current account plus the financial
             account—both equal to positive entries minus negative entries—is equal to zero.
               But what determines the current account and the financial account?

             Modeling the Financial Account
             A country’s financial account measures its net sales of assets, such as currencies, securi-
             ties, and factories, to foreigners. Those assets are exchanged for a type of capital called
             financial capital, which is funds from savings that are available for investment spending.
             We can thus think of the financial account as a measure of capital inflows in the form of
             foreign savings that become available to finance domestic investment spending.
               What determines these capital inflows?                                                                  Section 8 The Open Economy: International Trade and Finance
               Part of our explanation will have to wait for a little while because some international
             capital flows are created by governments and central banks, which sometimes act very
             differently from private investors. But we can gain insight into the motivations for cap-
             ital flows that are the result of private decisions by using the loanable funds model we de-
             veloped previously. In using this model, we make two important simplifications:
             ■ We simplify the reality of international capital flows by assuming that all flows are
               in the form of loans. In reality, capital flows take many forms, including purchases
               of shares of stock in foreign companies and foreign real estate as well as foreign di-
               rect investment, in which companies build factories or acquire other productive as-
               sets abroad.
             ■ We also ignore the effects of expected changes in exchange rates, the relative values
               of different national currencies. We’ll analyze the determination of exchange
               rates later.
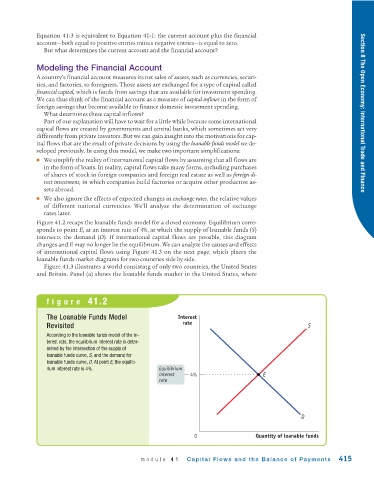
             Figure 41.2 recaps the loanable funds model for a closed economy. Equilibrium corre-
             sponds to point E, at an interest rate of 4%, at which the supply of loanable funds (S)
             intersects the demand (D). If international capital flows are possible, this diagram
             changes and E may no longer be the equilibrium. We can analyze the causes and effects
             of international capital flows using Figure 41.3 on the next page, which places the
             loanable funds market diagrams for two countries side by side.
               Figure 41.3 illustrates a world consisting of only two countries, the United States
             and Britain. Panel (a) shows the loanable funds market in the United States, where


                figure 41.2

                The Loanable Funds Model                   Interest
                                                             rate
                Revisited                                                                             S
                According to the loanable funds model of the in-
                terest rate, the equilibrium interest rate is deter-
                mined by the intersection of the supply of
                loanable funds curve, S, and the demand for
                loanable funds curve, D. At point E, the equilib-
                rium interest rate is 4%.            Equilibrium
                                                     interest  4%                      E
                                                     rate


                                                                                                    D


                                                                 0                   Quantity of loanable funds


                                               module 41      Capital Flows and the Balance of Payments         415

