Page 453 - Krugmans Economics for AP Text Book_Neat
P. 453
table 41.1

              The Costas’ Financial Year

                                    Sources of cash        Uses of cash         Net
              Purchases or sales   Artichoke sales:   Farm operation and     −$10,000
              of goods and services  $100,000         living expenses: $110,000
              Interest payments    Interest received on   Interest paid on   −$9,500
                                   bank account: $500  mortgage: $10,000
              Loans and deposits   Funds received from  Funds deposited in   +$19,500
                                   new loan: $25,000  bank: $5,500                                                     Section 8 The Open Economy: International Trade and Finance
              Total                $125,500           $125,500               $0


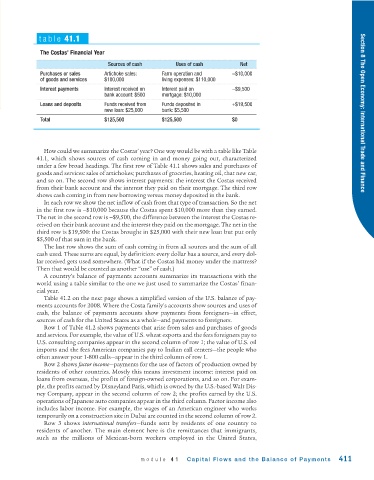
               How could we summarize the Costas’ year? One way would be with a table like Table
             41.1, which shows sources of cash coming in and money going out, characterized
             under a few broad headings. The first row of Table 41.1 shows sales and purchases of
             goods and services: sales of artichokes; purchases of groceries, heating oil, that new car,
             and so on. The second row shows interest payments: the interest the Costas received
             from their bank account and the interest they paid on their mortgage. The third row
             shows cash coming in from new borrowing versus money deposited in the bank.
               In each row we show the net inflow of cash from that type of transaction. So the net
             in the first row is −$10,000 because the Costas spent $10,000 more than they earned.
             The net in the second row is −$9,500, the difference between the interest the Costas re-
             ceived on their bank account and the interest they paid on the mortgage. The net in the
             third row is $19,500: the Costas brought in $25,000 with their new loan but put only
             $5,500 of that sum in the bank.
               The last row shows the sum of cash coming in from all sources and the sum of all
             cash used. These sums are equal, by definition: every dollar has a source, and every dol-
             lar received gets used somewhere. (What if the Costas hid money under the mattress?
             Then that would be counted as another “use” of cash.)
               A country’s balance of payments accounts summarize its transactions with the
             world using a table similar to the one we just used to summarize the Costas’ finan-
             cial year.
               Table 41.2 on the next page shows a simplified version of the U.S. balance of pay-
             ments accounts for 2008. Where the Costa family’s accounts show sources and uses of
             cash, the balance of payments accounts show payments from foreigners—in effect,
             sources of cash for the United States as a whole—and payments to foreigners.
               Row 1 of Table 41.2 shows payments that arise from sales and purchases of goods
             and services. For example, the value of U.S. wheat exports and the fees foreigners pay to
             U.S. consulting companies appear in the second column of row 1; the value of U.S. oil
             imports and the fees American companies pay to Indian call  centers—the people who
             often answer your 1-800 calls—appear in the third column of row 1.
               Row 2 shows factor income—payments for the use of factors of production owned by
             residents of other countries. Mostly this means investment income: interest paid on
             loans from overseas, the profits of foreign - owned corporations, and so on. For exam-
             ple, the profits earned by Disneyland Paris, which is owned by the U.S.-based Walt Dis-
             ney Company, appear in the second column of row 2; the profits earned by the U.S.
             operations of Japanese auto companies appear in the third column. Factor income also
             includes labor income. For example, the wages of an American engineer who works
             temporarily on a construction site in Dubai are counted in the second column of row 2.
               Row 3 shows  international transfers—funds sent by residents of one country to
             residents of another. The main element here is the remittances that immigrants,
             such as the millions of Mexican -born workers employed in the United States,


                                               module 41      Capital Flows and the Balance of Payments         411

