Page 510 - Krugmans Economics for AP Text Book_Neat
P. 510
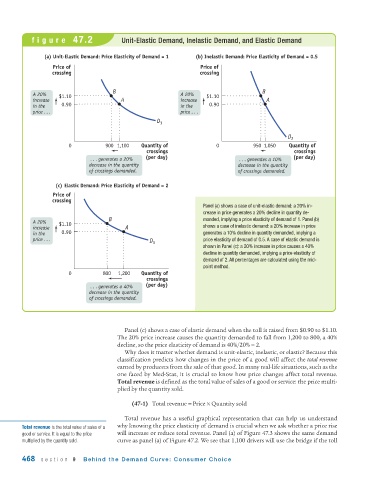
figure 47.2                   Unit-Elastic Demand, Inelastic Demand, and Elastic Demand


                (a) Unit-Elastic Demand: Price Elasticity of Demand = 1  (b) Inelastic Demand: Price Elasticity of Demand = 0.5
                  Price of                                         Price of
                  crossing                                        crossing


                                      B                                                B
            A 20%   $1.10                                   A 20%    $1.10
            increase                     A                  increase                    A
            in the   0.90                                   in the   0.90
            price . . .                                     price . . .

                                                    D 1
                                                                                               D 2
                        0           900 1,100  Quantity of              0           950 1,050   Quantity of
                                                 crossings                                       crossings
                               . . . generates a 20%   (per day)                . . . generates a 10%   (per day)
                              decrease in the quantity                         decrease in the quantity
                              of crossings demanded.                           of crossings demanded.

                   (c) Elastic Demand: Price Elasticity of Demand = 2
                  Price of
                  crossing
                                                                   Panel (a) shows a case of unit-elastic demand: a 20% in-
                                                                   crease in price generates a 20% decline in quantity de-
                                     B                             manded, implying a price elasticity of demand of 1. Panel (b)
            A 20%   $1.10
            increase                      A                        shows a case of inelastic demand: a 20% increase in price
            in the   0.90                                          generates a 10% decline in quantity demanded, implying a
            price . . .                           D 3              price elasticity of demand of 0.5. A case of elastic demand is
                                                                   shown in Panel (c): a 20% increase in price causes a 40%
                                                                   decline in quantity demanded, implying a price elasticity of
                                                                   demand of 2. All percentages are calculated using the mid-
                                                                   point method.
                        0          800  1,200  Quantity of
                                                 crossings
                               . . . generates a 40%   (per day)
                              decrease in the quantity
                              of crossings demanded.


                                          Panel (c) shows a case of elastic demand when the toll is raised from $0.90 to $1.10.
                                       The 20% price increase causes the quantity demanded to fall from 1,200 to 800, a 40%
                                       decline, so the price elasticity of demand is 40%/20% = 2.
                                          Why does it matter whether demand is unit-elastic, inelastic, or elastic? Because this
                                       classification predicts how changes in the price of a good will affect the total revenue
                                       earned by producers from the sale of that good. In many real-life situations, such as the
                                       one faced by Med-Stat, it is crucial to know how price changes affect total revenue.
                                       Total revenue is defined as the total value of sales of a good or service: the price multi-
                                       plied by the quantity sold.

                                            (47-1) Total revenue = Price × Quantity sold

                                          Total revenue has a useful graphical representation that can help us understand
        Total revenue is the total value of sales of a  why knowing the price elasticity of demand is crucial when we ask whether a price rise
        good or service. It is equal to the price  will increase or reduce total revenue. Panel (a) of Figure 47.3 shows the same demand
        multiplied by the quantity sold.  curve as panel (a) of Figure 47.2. We see that 1,100 drivers will use the bridge if the toll
        468   section 9     Behind the Demand Curve: Consumer Choice

