Page 511 - Krugmans Economics for AP Text Book_Neat
P. 511
figure 47.3                   Total Revenue


                              (a) Total Revenue by Area                    (b) Effect of a Price Increase on Total Revenue

                Price of                                           Price of
                crossing                                           crossing               Price effect of price
                                                                                          increase: higher price
                                                                                          for each unit sold

                                                                                                   Quantity effect
                                                                     $1.10                         of price            Section 9 Behind the Demand Curve: Consumer Choice
                                                                                 C                 increase: fewer
                  $0.90                                               0.90
                                                                                                   units sold
                          Total revenue =                                                                   D
                          price x quantity =             D                       B        A
                          $990


                     0                  1,100      Quantity of          0               900 1,100     Quantity of
                                             crossings (per day)                                crossings (per day)


                       The green rectangle in panel (a) represents total revenue generated  Due to the quantity effect, total revenue falls by area A. Due to the price
                       from 1,100 drivers who each pay a toll of $0.90. Panel (b) shows how  effect, total revenue increases by area C. In general, the overall effect
                       total revenue is affected when the price increases from $0.90 to $1.10.  can go either way, depending on the price elasticity of demand.


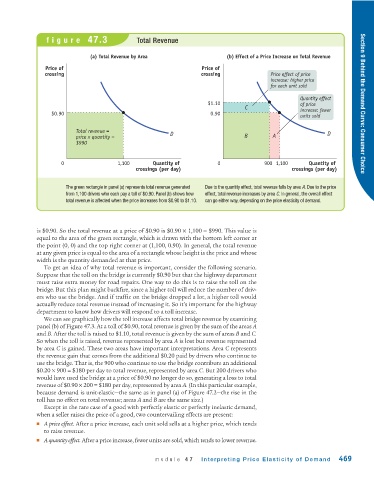
             is $0.90. So the total revenue at a price of $0.90 is $0.90 × 1,100 = $990. This value is
             equal to the area of the green rectangle, which is drawn with the bottom left corner at
             the point (0, 0) and the top right corner at (1,100, 0.90). In general, the total revenue
             at any given price is equal to the area of a rectangle whose height is the price and whose
             width is the quantity demanded at that price.
               To get an idea of why total revenue is important, consider the following scenario.
             Suppose that the toll on the bridge is currently $0.90 but that the highway department
             must raise extra money for road repairs. One way to do this is to raise the toll on the
             bridge. But this plan might backfire, since a higher toll will reduce the number of driv-
             ers who use the bridge. And if traffic on the bridge dropped a lot, a higher toll would
             actually reduce total revenue instead of increasing it. So it’s important for the highway
             department to know how drivers will respond to a toll increase.
               We can see graphically how the toll increase affects total bridge revenue by examining
             panel (b) of Figure 47.3. At a toll of $0.90, total revenue is given by the sum of the areas A
             and B. After the toll is raised to $1.10, total revenue is given by the sum of areas B and C.
             So when the toll is raised, revenue represented by area A is lost but revenue represented
             by area C is gained. These two areas have important interpretations. Area C represents
             the revenue gain that comes from the additional $0.20 paid by drivers who continue to
             use the bridge. That is, the 900 who continue to use the bridge contribute an additional
             $0.20 × 900 = $180 per day to total revenue, represented by area C. But 200 drivers who
             would have used the bridge at a price of $0.90 no longer do so, generating a loss to total
             revenue of $0.90 × 200 = $180 per day, represented by area A. (In this particular example,
             because demand is unit-elastic—the same as in panel (a) of Figure 47.2—the rise in the
             toll has no effect on total revenue; areas A and B are the same size.)
               Except in the rare case of a good with perfectly elastic or perfectly inelastic demand,
             when a seller raises the price of a good, two countervailing effects are present:
             ■ A price effect. After a price increase, each unit sold sells at a higher price, which tends
               to raise revenue.
             ■ A quantity effect. After a price increase, fewer units are sold, which tends to lower revenue.


                                                    module 47      Interpreting Price Elasticity of Demand      469

