Page 513 - Krugmans Economics for AP Text Book_Neat
P. 513

■ When demand is unit-elastic, the two effects exactly balance each other out; so a fall
               in price has no effect on total revenue.
             ■ When demand is inelastic, the price effect dominates the quantity effect; so a fall in
               price reduces total revenue.
             ■ When demand is elastic, the quantity effect dominates the price effect; so a fall in
               price increases total revenue.

             Price Elasticity Along the Demand Curve
             Suppose an economist says that “the price elasticity of demand for coffee is 0.25.”                       Section 9 Behind the Demand Curve: Consumer Choice
             What he or she means is that at the current price the elasticity is 0.25. In the previous dis-
             cussion of the toll bridge, what we were really describing was the elasticity at the price of
             $0.90. Why this qualification? Because for the vast majority of demand curves, the
             price elasticity of demand at one point along the curve is different from the price elas-
             ticity of demand at other points along the same curve.
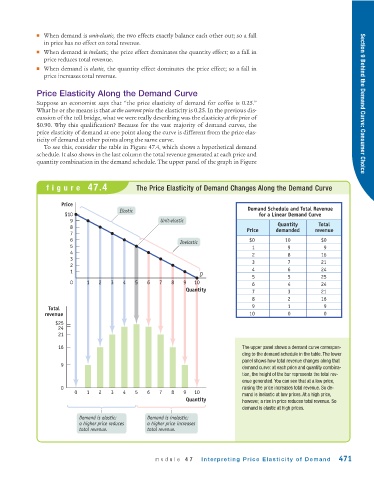
               To see this, consider the table in Figure 47.4, which shows a hypothetical demand
             schedule. It also shows in the last column the total revenue generated at each price and
             quantity combination in the demand schedule. The upper panel of the graph in Figure


                figure 47.4                   The Price Elasticity of Demand Changes Along the Demand Curve


                     Price
                                                                                  Demand Schedule and Total Revenue
                                        Elastic
                      $10                                                             for a Linear Demand Curve
                        9                             Unit-elastic
                        8                                                                   Quantity     Total
                        7                                                         Price    demanded     revenue
                        6                                   Inelastic              $0         10          $0
                        5                                                           1          9           9
                        4                                                           2          8          16
                        3                                                           3          7          21
                        2
                        1                                                           4          6          24
                                                                  D                 5          5          25
                        0    1   2   3   4   5   6   7   8   9   10                 6          4          24
                                                              Quantity              7          3          21
                                                                                    8          2          16
                                                                                    9          1           9
                 Total
                revenue                                                            10          0           0
                   $25
                    24
                    21
                    16                                                          The upper panel shows a demand curve correspon-
                                                                                ding to the demand schedule in the table. The lower
                                                                                panel shows how total revenue changes along that
                     9
                                                                                demand curve: at each price and quantity combina-
                                                                                tion, the height of the bar represents the total rev-
                                                                                enue generated. You can see that at a low price,
                     0                                                          raising the price increases total revenue. So de-
                         0   1   2   3   4   5   6   7   8   9   10
                                                                                mand is inelastic at low prices. At a high price,
                                                              Quantity          however, a rise in price reduces total revenue. So
                                                                                demand is elastic at high prices.
                           Demand is elastic:    Demand is inelastic:
                           a higher price reduces  a higher price increases
                           total revenue.        total revenue.


                                                    module 47      Interpreting Price Elasticity of Demand      471
   508   509   510   511   512   513   514   515   516   517   518