Page 560 - Krugmans Economics for AP Text Book_Neat
P. 560

Spending the Marginal Dollar
        The marginal utility per dollar spent
        on a good or service is the additional utility
                                       As we’ve just seen, we can find Sammy’s optimal consumption choice by finding the
        from spending one more dollar on that good
                                       total utility he receives from each consumption bundle on his budget line and then
        or service.
                                       choosing the bundle at which total utility is maximized. But we can use marginal
                                       analysis instead, turning Sammy’s problem of finding his optimal consumption choice
                                       into a “how much” problem. How do we do this? By thinking about choosing an opti-
                                       mal consumption bundle as a problem of how much to spend on each good. That is, to find
                                       the optimal consumption bundle with marginal analysis we ask the question of
                                       whether Sammy can make himself better off by spending a little bit more of his income
                                       on clams and less on potatoes, or by doing the opposite—spending a little bit more on
                                       potatoes and less on clams. In other words, the marginal decision is a question of how
                                       to spend the marginal dollar—how to allocate an additional dollar between clams and po-
                                       tatoes in a way that maximizes utility.
                                          Our first step in applying marginal analysis is to ask if Sammy is made better off by
                                       spending an additional dollar on either good; and if so, by how much is he better off.
                                       To answer this question we must calculate the marginal utility per dollar spent on ei-
                                       ther clams or potatoes—how much additional utility Sammy gets from spending an ad-
                                       ditional dollar on either good.

                                       Marginal Utility per Dollar
                                       We’ve already introduced the concept of marginal utility, the additional utility a con-
                                       sumer gets from consuming one more unit of a good or service; now let’s see how this
                                       concept can be used to derive the related measure of marginal utility per dollar.
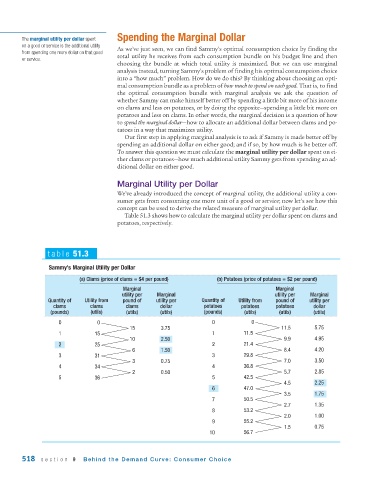
                                          Table 51.3 shows how to calculate the marginal utility per dollar spent on clams and
                                       potatoes, respectively.


                 table 51.3

                 Sammy’s Marginal Utility per Dollar
                           (a) Clams (price of clams = $4 per pound)    (b) Potatoes (price of potatoes = $2 per pound)
                                         Marginal                                          Marginal
                                         utility per  Marginal                             utility per  Marginal
                 Quantity of  Utility from  pound of  utility per  Quantity of  Utility from  pound of  utility per
                  clams        clams      clams      dollar         potatoes    potatoes   potatoes     dollar
                  (pounds)     (utils)    (utils)    (utils)        (pounds)     (utils)    (utils)     (utils)
                    0            0                                    0            0
                                           15         3.75                                   11.5       5.75
                    1           15                                    1          11.5
                                           10         2.50                                    9.9       4.95
                    2           25                                    2          21.4
                                            6         1.50                                    8.4       4.20
                    3           31                                    3          29.8
                                            3         0.75                                    7.0       3.50
                    4           34                                    4          36.8
                                            2         0.50                                    5.7       2.85
                    5           36                                    5          42.5
                                                                                              4.5       2.25
                                                                      6          47.0
                                                                                              3.5       1.75
                                                                      7          50.5
                                                                                              2.7       1.35
                                                                      8          53.2
                                                                                              2.0       1.00
                                                                      9          55.2
                                                                                              1.5       0.75
                                                                      10         56.7


        518   section 9     Behind the Demand Curve: Consumer Choice
   555   556   557   558   559   560   561   562   563   564   565