Page 559 - Krugmans Economics for AP Text Book_Neat
P. 559

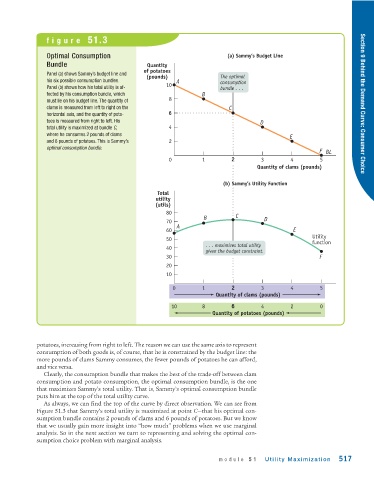
figure 51.3


                Optimal Consumption                                        (a) Sammy’s Budget Line
                Bundle                           Quantity
                                                of potatoes
                Panel (a) shows Sammy’s budget line and
                                                 (pounds)                The optimal
                his six possible consumption bundles.      A             consumption
                                                       10
                Panel (b) shows how his total utility is af-             bundle . . .
                fected by his consumption bundle, which            B
                must lie on his budget line. The quantity of  8                                                        Section 9 Behind the Demand Curve: Consumer Choice
                clams is measured from left to right on the                 C
                horizontal axis, and the quantity of pota-  6
                toes is measured from right to left. His                              D
                total utility is maximized at bundle C,  4
                where he consumes 2 pounds of clams
                                                                                                E
                and 6 pounds of potatoes. This is Sammy’s  2
                optimal consumption bundle.
                                                                                                          F  BL
                                                        0          1         2        3         4         5
                                                                                     Quantity of clams (pounds)

                                                                          (b) Sammy's Utility Function
                                                     Total
                                                    utility
                                                    (utils)
                                                       80
                                                                    B         C        D
                                                       70
                                                           A
                                                       60                                        E
                                                                                                       Utility
                                                       50                                              function
                                                                    . . . maximizes total utility
                                                       40
                                                                    given the budget constraint.
                                                       30                                                 F
                                                       20
                                                       10
                                                          0        1         2        3         4         5
                                                                        Quantity of clams (pounds)
                                                         10        8         6        4         2         0
                                                                       Quantity of potatoes (pounds)


             potatoes, increasing from right to left. The reason we can use the same axis to represent
             consumption of both goods is, of course, that he is constrained by the budget line: the
             more pounds of clams Sammy consumes, the fewer pounds of potatoes he can afford,
             and vice versa.
               Clearly, the consumption bundle that makes the best of the trade-off between clam
             consumption and potato consumption, the optimal consumption bundle, is the one
             that maximizes Sammy’s total utility. That is, Sammy’s optimal consumption bundle
             puts him at the top of the total utility curve.
               As always, we can find the top of the curve by direct observation. We can see from
             Figure 51.3 that Sammy’s total utility is maximized at point C—that his optimal con-
             sumption bundle contains 2 pounds of clams and 6 pounds of potatoes. But we know
             that we usually gain more insight into “how much” problems when we use marginal
             analysis. So in the next section we turn to representing and solving the optimal con-
             sumption choice problem with marginal analysis.


                                                                         module 51      Utility Maximization    517
   554   555   556   557   558   559   560   561   562   563   564