
Page 662 - Krugmans Economics for AP Text Book_Neat
P. 662
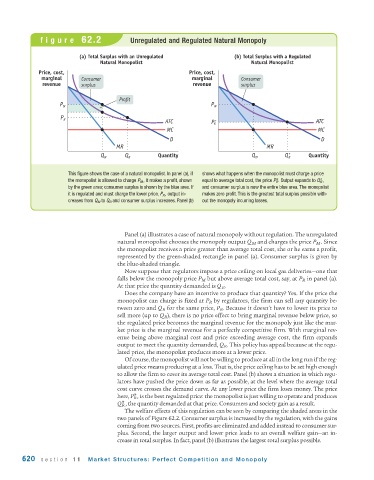
figure  62.2                  Unregulated and Regulated Natural Monopoly


                           (a) Total Surplus with an Unregulated              (b) Total Surplus with a Regulated
                                  Natural Monopolist                               Natural Monopolist
              Price, cost,                                     Price, cost,
               marginal     Consumer                            marginal        Consumer
               revenue      surplus                             revenue         surplus

                                        Profit
                     P M                                              P M

                     P R
                                                       ATC            P R *                             ATC
                                                        MC                                               MC
                                                         D                                                D
                                       MR                                               MR
                                  Q M     Q R        Quantity                      Q M        Q * R   Quantity


                       This figure shows the case of a natural monopolist. In panel (a), if  shows what happens when the monopolist must charge a price
                       the monopolist is allowed to charge P M , it makes a profit, shown  equal to average total cost, the price P* R . Output expands to Q* R ,
                       by the green area; consumer surplus is shown by the blue area. If  and consumer surplus is now the entire blue area. The monopolist
                       it is regulated and must charge the lower price, P R , output in-  makes zero profit. This is the greatest total surplus possible with-
                       creases from Q M to Q R and consumer surplus increases. Panel (b)  out the monopoly incurring losses.


                                          Panel (a) illustrates a case of natural monopoly without regulation. The unregulated
                                       natural monopolist chooses the monopoly output Q M and charges the price P M . Since
                                       the monopolist receives a price greater than average total cost, she or he earns a profit,
                                       represented by the green-shaded rectangle in panel (a). Consumer surplus is given by
                                       the blue-shaded triangle.
                                          Now suppose that regulators impose a price ceiling on local gas deliveries—one that
                                       falls below the monopoly price P M but above average total cost, say, at P R in panel (a).
                                       At that price the quantity demanded is Q R .
                                          Does the company have an incentive to produce that quantity? Yes. If the price the
                                       monopolist can charge is fixed at P R by regulators, the firm can sell any quantity be-
                                       tween zero and Q R for the same price, P R . Because it doesn’t have to lower its price to
                                       sell more (up to Q R ), there is no price effect to bring marginal revenue below price, so
                                       the regulated price becomes the marginal revenue for the monopoly just like the mar-
                                       ket price is the marginal revenue for a perfectly competitive firm. With marginal rev-
                                       enue being above marginal cost and price exceeding average cost, the firm expands
                                       output to meet the quantity demanded, Q R . This policy has appeal because at the regu-
                                       lated price, the monopolist produces more at a lower price.
                                          Of course, the monopolist will not be willing to produce at all in the long run if the reg-
                                       ulated price means producing at a loss. That is, the price ceiling has to be set high enough
                                       to allow the firm to cover its average total cost. Panel (b) shows a situation in which regu-
                                       lators have pushed the price down as far as possible, at the level where the average total
                                       cost curve crosses the demand curve. At any lower price the firm loses money. The price
                                       here, P*, is the best regulated price: the monopolist is just willing to operate and produces
                                             R
                                       Q*, the quantity demanded at that price. Consumers and society gain as a result.
                                         R
                                          The welfare effects of this regulation can be seen by comparing the shaded areas in the
                                       two panels of Figure 62.2. Consumer surplus is increased by the regulation, with the gains
                                       coming from two sources. First, profits are eliminated and added instead to consumer sur-
                                       plus. Second, the larger output and lower price leads to an overall welfare gain—an in-
                                       crease in total surplus. In fact, panel (b) illustrates the largest total surplus possible.

        620   section  11     Market Structures: Perfect Competition and Monopoly