Page 665 - Krugmans Economics for AP Text Book_Neat
P. 665
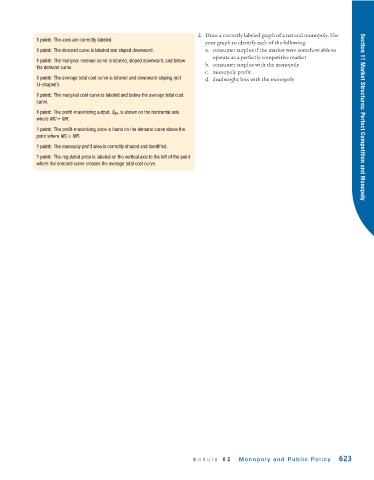
2. Draw a correctly labeled graph of a natural monopoly. Use
             1 point: The axes are correctly labeled.
                                                                    your graph to identify each of the following:
             1 point: The demand curve is labeled and sloped downward.  a. consumer surplus if the market were somehow able to
                                                                       operate as a perfectly competitive market
             1 point: The marginal revenue curve is labeled, sloped downward, and below
                                                                    b. consumer surplus with the monopoly
             the demand curve.
                                                                    c. monopoly profit
             1 point: The average total cost curve is labeled and downward sloping (not  d. deadweight loss with the monopoly
             U-shaped!).
             1 point: The marginal cost curve is labeled and below the average total cost
             curve.
             1 point: The profit-maximizing output, Q M , is shown on the horizontal axis
             where MC = MR.                                                                                            Section 11 Market Structures: Perfect Competition and Monopoly
             1 point: The profit-maximizing price is found on the demand curve above the
             point where MC = MR.

             1 point: The monopoly profit area is correctly shaded and identified.
             1 point: The regulated price is labeled on the vertical axis to the left of the point
             where the demand curve crosses the average total cost curve.


                                                                module 62      Monopoly and Public Policy       623

