
Page 727 - Krugmans Economics for AP Text Book_Neat
P. 727
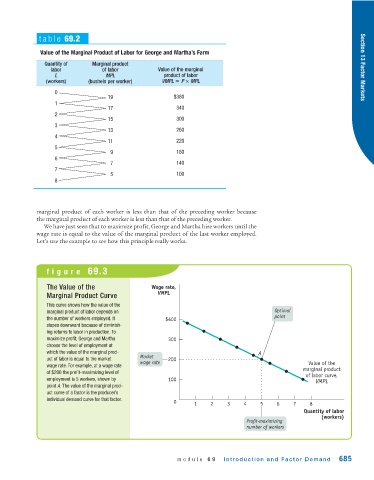
table 69.2

              Value of the Marginal Product of Labor for George and Martha’s Farm

                Quantity of    Marginal product
                  labor           of labor           Value of the marginal                                             Section 13 Factor Markets
                   L                MPL                product of labor
                (workers)     (bushels per worker)    VMPL   P × MPL
                   0
                                    19                    $380
                   1
                                    17                     340
                   2
                                    15                     300
                   3
                                    13                     260
                   4
                                    11                     220
                   5
                                     9                     180
                   6
                                     7                     140
                   7
                                     5                     100
                   8


             marginal product of each worker is less than that of the preceding worker because
             the marginal product of each worker is less than that of the preceding worker.
               We have just seen that to maximize profit, George and Martha hire workers until the
             wage rate is equal to the value of the marginal product of the last worker employed.
             Let’s use the example to see how this principle really works.


                figure  69.3


                The Value of the                   Wage rate,
                                                     VMPL
                Marginal Product Curve
                This curve shows how the value of the
                marginal product of labor depends on                                       Optimal
                the number of workers employed. It     $400                                point
                slopes downward because of diminish-
                ing returns to labor in production. To
                maximize profit, George and Martha      300
                choose the level of employment at
                which the value of the marginal prod-                                 A
                uct of labor is equal to the market  Market  200
                                               wage rate                                              Value of the
                wage rate. For example, at a wage rate                                              marginal product
                of $200 the profit-maximizing level of                                               of labor curve,
                employment is 5 workers, shown by       100                                             VMPL
                point A. The value of the marginal prod-
                uct curve of a factor is the producer’s
                individual demand curve for that factor.
                                                          0      1    2    3     4    5     6    7    8
                                                                                                    Quantity of labor
                                                                                                          (workers)
                                                                                  Profit-maximizing
                                                                                  number of workers


                                                           module  69     Introduction and Factor Demand        685