
Page 772 - Krugmans Economics for AP Text Book_Neat
P. 772
Tackle the Test: Multiple-Choice Questions
1. The socially optimal level of pollution is 4. The Coase theorem asserts that, under the right circumstances,
a. less than that created by the market, but not zero. inefficiencies created by externalities can be dealt with through
b. more than that created by the market. a. lawsuits.
c. whatever the market creates. b. private bargaining.
d. determined by firms. c. vigilante actions.
e. zero. d. government policies.
e. mediation.
2. Which of the following is a source of negative externalities?
a. loud conversations in a library 5. Which of the following makes it more likely that private
b. smokestack scrubbers solutions to externality problems will succeed?
c. a beautiful view a. high transaction costs
d. national defense b. high prices for legal services
e. a decision to purchase dressy but uncomfortable shoes. c. delays in the bargaining process
d. a small number of affected parties
3. Inefficiencies created by externalities can be dealt with through
e. loosely defined legal rights
a. government actions only.
b. private actions only.
c. market outcomes only.
d. either private or government actions.
e. neither private nor government actions.
Tackle the Test: Free-Response Questions
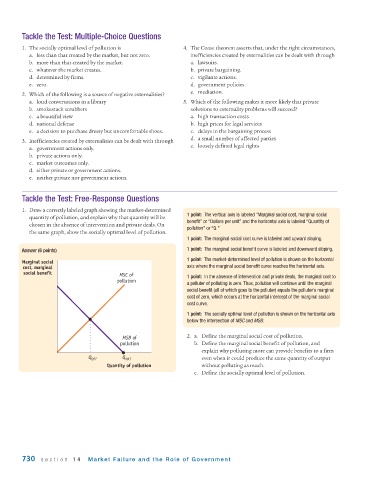
1. Draw a correctly labeled graph showing the market-determined
1 point: The vertical axis is labeled “Marginal social cost, marginal social
quantity of pollution, and explain why that quantity will be
benefit” or “Dollars per unit” and the horizontal axis is labeled “Quantity of
chosen in the absence of intervention and private deals. On
pollution” or “Q.”
the same graph, show the socially optimal level of pollution.
1 point: The marginal social cost curve is labeled and upward sloping.
Answer (6 points) 1 point: The marginal social benefit curve is labeled and downward sloping.
1 point: The market-determined level of pollution is shown on the horizontal
Marginal social
cost, marginal axis where the marginal social benefit curve reaches the horizontal axis.
social benefit MSC of 1 point: In the absence of intervention and private deals, the marginal cost to
pollution
a polluter of polluting is zero. Thus, pollution will continue until the marginal
social benefit (all of which goes to the polluter) equals the polluter’s marginal
cost of zero, which occurs at the horizontal intercept of the marginal social
cost curve.
1 point: The socially optimal level of pollution is shown on the horizontal axis
below the intersection of MSC and MSB.
MSB of 2. a. Define the marginal social cost of pollution.
pollution b. Define the marginal social benefit of pollution, and
explain why polluting more can provide benefits to a firm
Q QPT Q MKT even when it could produce the same quantity of output
Quantity of pollution without polluting as much.
c. Define the socially optimal level of pollution.
730 section 14 Market Failure and the Role of Gover nment