
Page 775 - Krugmans Economics for AP Text Book_Neat
P. 775
It’s now easy to see how an emissions tax can solve the problem. If power com-
panies are required to pay a tax of $200 per ton of emissions, they face a marginal
cost of $200 per ton and have an incentive to reduce emissions to Q OPT , the so-
cially optimal quantity. This illustrates a general result: an emissions tax equal to
the marginal social cost at the socially optimal quantity of pollution induces pol-
luters to internalize the externality—to take into account the true cost to society
of their actions.
Why is an emissions tax an efficient way (that is, a cost-minimizing way) to reduce
pollution but environmental standards generally are not? Because an emissions tax en-
sures that the marginal benefit of pollution is equal for all sources of pollution, but an Section 14 Market Failure and the Role of Government
environmental standard does not. Figure 75.2 shows a hypothetical industry consist-
ing of only two plants, plant A and plant B. We’ll assume that plant A uses newer tech-
nology than plant B and so has a lower cost of reducing pollution. Reflecting this
difference in costs, plant A’s marginal benefit of pollution curve, MB A , lies below plant
B’s marginal benefit of pollution curve, MB B . Because it is more costly for plant B to re-
duce its pollution at any output quantity, an additional ton of pollution is worth more
to plant B than to plant A.
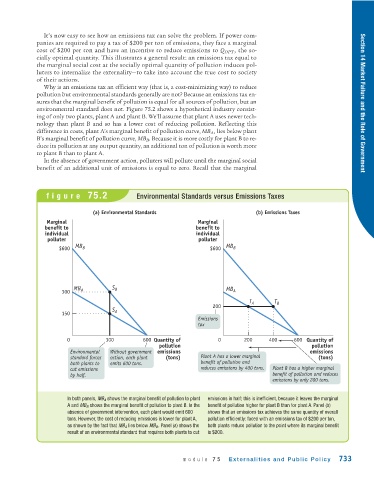
In the absence of government action, polluters will pollute until the marginal social
benefit of an additional unit of emissions is equal to zero. Recall that the marginal
figure 75.2 Environmental Standards versus Emissions Taxes
(a) Environmental Standards (b) Emissions Taxes
Marginal Marginal
benefit to benefit to
individual individual
polluter polluter
MB MB
$600 B $600 B
MB A S B MB
300 A
T A T B
200
S A
150
Emissions
tax
0 300 600 Quantity of 0 200 400 600 Quantity of
pollution pollution
Environmental Without government emissions emissions
standard forces action, each plant (tons) Plant A has a lower marginal (tons)
both plants to emits 600 tons. benefit of pollution and
cut emissions reduces emissions by 400 tons. Plant B has a higher marginal
by half. benefit of pollution and reduces
emissions by only 200 tons.
In both panels, MB A shows the marginal benefit of pollution to plant emissions in half; this is inefficient, because it leaves the marginal
A and MB B shows the marginal benefit of pollution to plant B. In the benefit of pollution higher for plant B than for plant A. Panel (b)
absence of government intervention, each plant would emit 600 shows that an emissions tax achieves the same quantity of overall
tons. However, the cost of reducing emissions is lower for plant A, pollution efficiently: faced with an emissions tax of $200 per ton,
as shown by the fact that MB A lies below MB B . Panel (a) shows the both plants reduce pollution to the point where its marginal benefit
result of an environmental standard that requires both plants to cut is $200.
module 75 Exter nalities and Public Policy 733