
Page 818 - Krugmans Economics for AP Text Book_Neat
P. 818
a. Draw the marginal social benefit curve and the marginal so- to voluntarily commit to reducing emissions from their 1988
cial cost curve. Use your diagram to determine the socially levels by 33% by 1992 and by 50% by 1995. The program actu-
optimal volume of music. ally met its second target by 1994.
b.Only the members of the sorority benefit from the music a. As in Figure 75.2 draw marginal benefit curves for pollution
and they bear none of the cost. Which volume of music will generated by two plants, A and B, in 1988. Assume that
they choose? without government intervention, each plant emits the
c. The college imposes a Pigouvian tax of $3 per decibel of same amount of pollution, but that at all levels of pollution
music played. From your diagram, determine the volume of less than this amount, plant A’s marginal benefit of pollut-
music the sorority will now choose. ing is less than that of plant B. Label the vertical axis “Mar-
ginal benefit to individual polluter” and the horizontal axis
3. Many dairy farmers in California are adopting a new technol- “Quantity of pollution emissions.” Mark the quantity of
ogy that allows them to produce their own electricity from pollution each plant produces without government action.
methane gas captured from animal wastes. (One cow can pro-
b.Do you expect the total quantity of pollution before the
duce up to 2 kilowatts a day.) This practice reduces the amount
program was put in place to have been less than or more
of methane gas released into the atmosphere. In addition to re-
than the optimal quantity of pollution? Why?
ducing their own utility bills, the farmers are allowed to sell
any electricity they produce at favorable rates. c. Suppose the plants whose marginal benefit curves you de-
picted in part a were participants in the 33/50 program. In a
a. Explain how the ability to earn money from capturing and
replica of your graph from part a, mark targeted levels of
transforming methane gas behaves like a Pigouvian tax on
pollution in 1995 for the two plants. Compare the amounts
methane gas pollution and can lead dairy farmers to emit
by which the two plants reduced emissions. Was this solu-
the efficient amount of methane gas pollution.
tion necessarily efficient?
b.Suppose some dairy farmers have lower costs of transform-
d.What kind of environmental policy does the 33/50 program
ing methane into electricity than others. Explain how this
most closely resemble? What is the main shortcoming of
system leads to an efficient allocation of emissions reduc-
such a policy? Compare it to two other types of environ-
tion among farmers.
mental policy discussed.
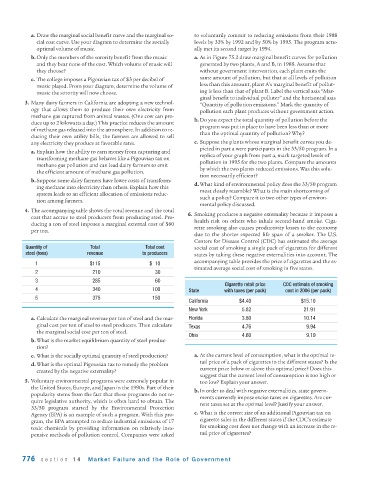
4. The accompanying table shows the total revenue and the total
6. Smoking produces a negative externality because it imposes a
cost that accrue to steel producers from producing steel. Pro-
health risk on others who inhale second-hand smoke. Ciga-
ducing a ton of steel imposes a marginal external cost of $60
rette smoking also causes productivity losses to the economy
per ton.
due to the shorter expected life span of a smoker. The U.S.
Centers for Disease Control (CDC) has estimated the average
Quantity of Total Total cost social cost of smoking a single pack of cigarettes for different
steel (tons) revenue to producers states by taking these negative externalities into account. The
accompanying table provides the price of cigarettes and the es-
1 $115 $ 10
timated average social cost of smoking in five states.
2 210 30
3 285 60
Cigarette retail price CDC estimate of smoking
4 340 100 State with taxes (per pack) cost in 2006 (per pack)
5 375 150
California $4.40 $15.10
New York 5.82 21.91
a. Calculate the marginal revenue per ton of steel and the mar- Florida 3.80 10.14
ginal cost per ton of steel to steel producers. Then calculate Texas 4.76 9.94
the marginal social cost per ton of steel.
Ohio 4.60 9.19
b.What is the market equilibrium quantity of steel produc-
tion?
c. What is the socially optimal quantity of steel production? a. At the current level of consumption, what is the optimal re-
tail price of a pack of cigarettes in the different states? Is the
d.What is the optimal Pigouvian tax to remedy the problem
current price below or above this optimal price? Does this
created by the negative externality?
suggest that the current level of consumption is too high or
5. Voluntary environmental programs were extremely popular in too low? Explain your answer.
the United States, Europe, and Japan in the 1990s. Part of their
b.In order to deal with negative externalities, state govern-
popularity stems from the fact that these programs do not re-
ments currently impose excise taxes on cigarettes. Are cur-
quire legislative authority, which is often hard to obtain. The
rent taxes set at the optimal level? Justify your answer.
33/50 program started by the Environmental Protection
Agency (EPA) is an example of such a program. With this pro- c. What is the correct size of an additional Pigouvian tax on
gram, the EPA attempted to reduce industrial emissions of 17 cigarette sales in the different states if the CDC’s estimate
toxic chemicals by providing information on relatively inex- for smoking cost does not change with an increase in the re-
pensive methods of pollution control. Companies were asked tail price of cigarettes?
776 section 14 Market Failure and the Role of Gover nment